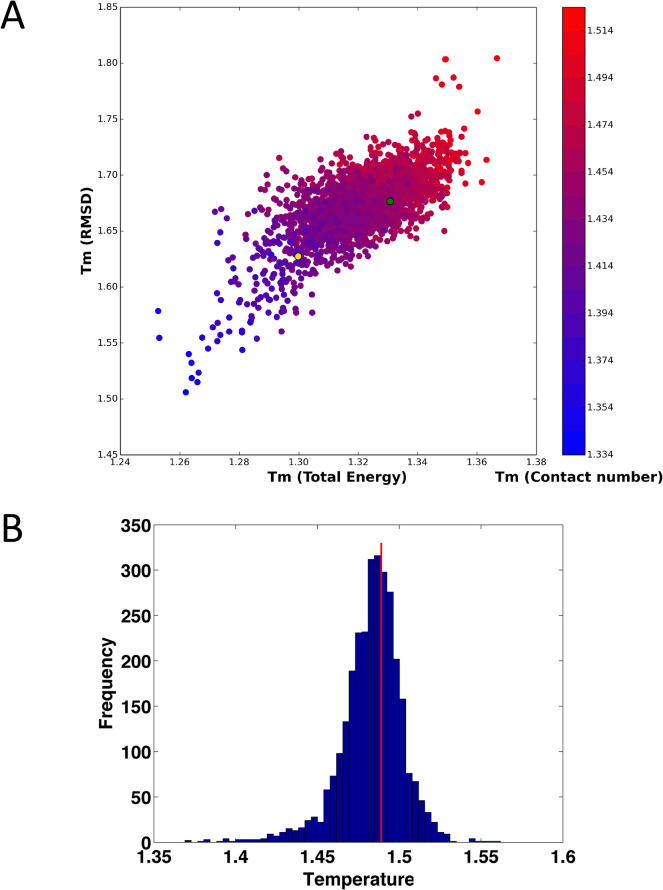
Fig 4. Simulated Tm values, based on RMSD, Total Energy and Contact number.
(A) Scatter plot of Tm (RMSD) vs. Tm (Total energy), with Tm (contact number) represented by color (see color bar to right of plot). The green ball denotes WT and the gold ball denotes the destabilized mutant I155A. The correlation coefficients of simulated Tm between RMSD and total energy, RMSD and Contact number, and Contact number and total energy were 0.68, 0.79 and 0.84, respectively. (B) Histogram of Tm values, determined by averaging the values obtained from RMSD, energy, and contact number. The vertical red line denotes WT Tm.

