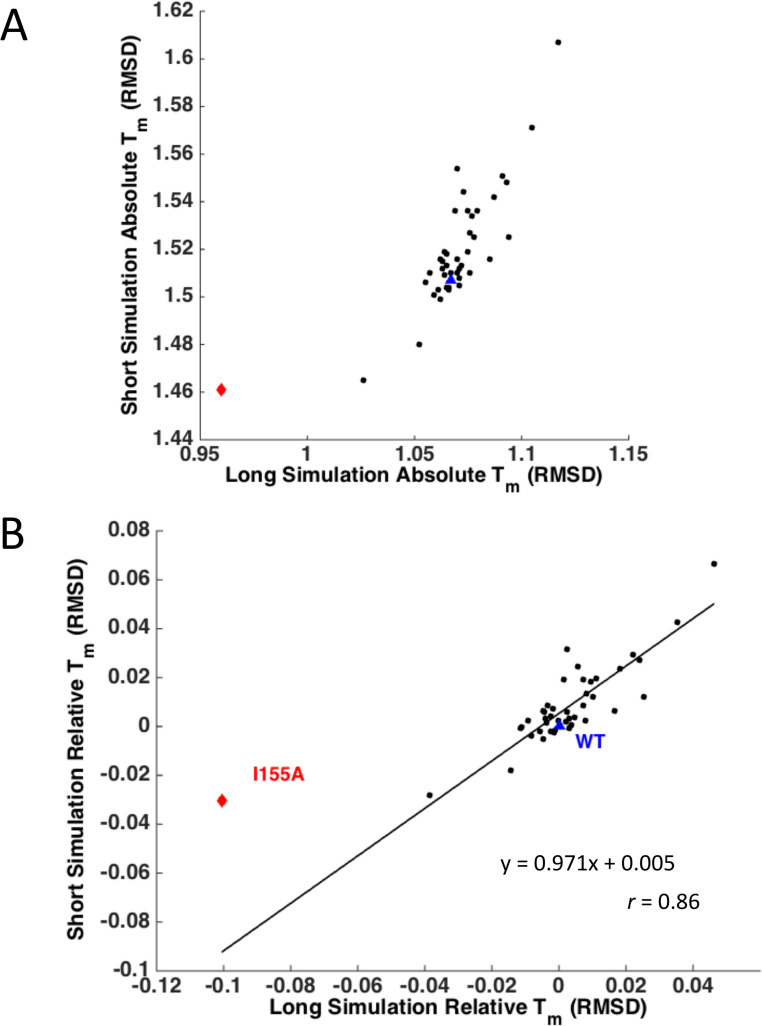
Fig 6. Correlation between Tm values for simulations of different lengths.
WT is shown as a blue triangle and mutant I155A as a red diamond. (A) Tm calculated from simulation RMSD, for short (2,000,000-step) and long (20,000,000-step) simulations. Simulation Tm is clearly smaller for long simulations, in which the protein has more time to unfold. (B) Relative Tm normalized to WT, for short and long simulations. Remarkably, the points fall nearly on the line y = x, with a correlation of 0.86, with one distinct outlier I155A.

