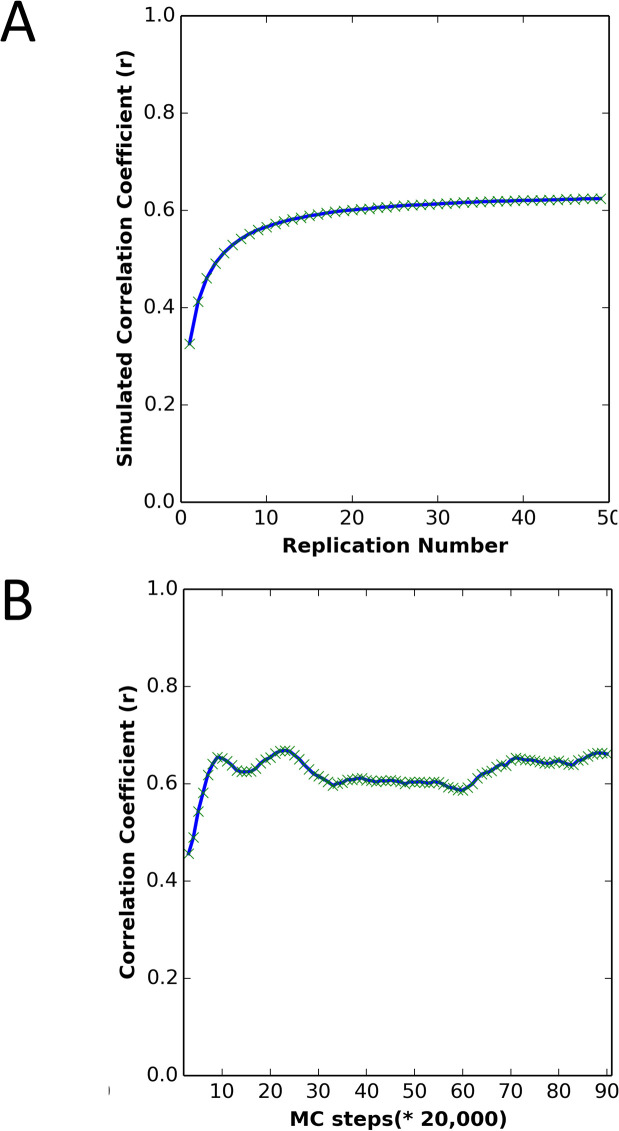
Fig 8. The effect of replication number and number of MC steps on simulation predictive power.
(A) Correlation between simulated Tm and experimental Tm, averaging over different numbers of replications, for the DHFR wild type and mutants. Each protein was simulated for 2,000,000 MC steps, following MD minimization and equilibration at low temperature. (B) Correlation between the simulated Tm and experimental Tm with different numbers of MC steps and 50 replications, for the DHFR wild type and mutants. Each protein was first simulated for the number of steps given on the x-axis, and the next 100,000 steps were averaged in determining the simulated Tm.

