Figure 5.

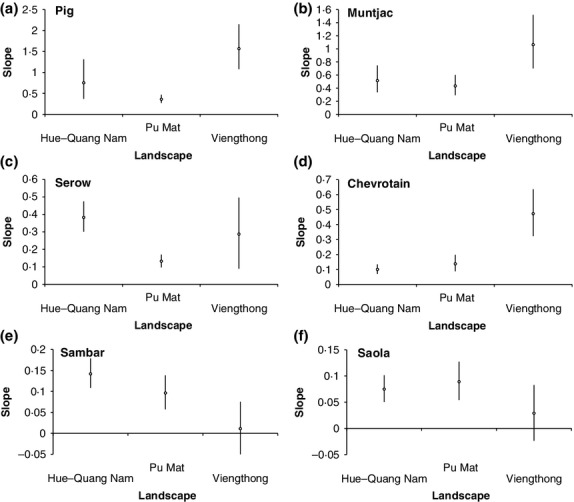
Slopes and 83% CIs of last-sighting-history data for pig, muntjac, serow, chevrotain, sambar and saola between Hue-Quang Nam, Pu Mat and Viengthong. Scale of y-axis varies between plots.

Slopes and 83% CIs of last-sighting-history data for pig, muntjac, serow, chevrotain, sambar and saola between Hue-Quang Nam, Pu Mat and Viengthong. Scale of y-axis varies between plots.