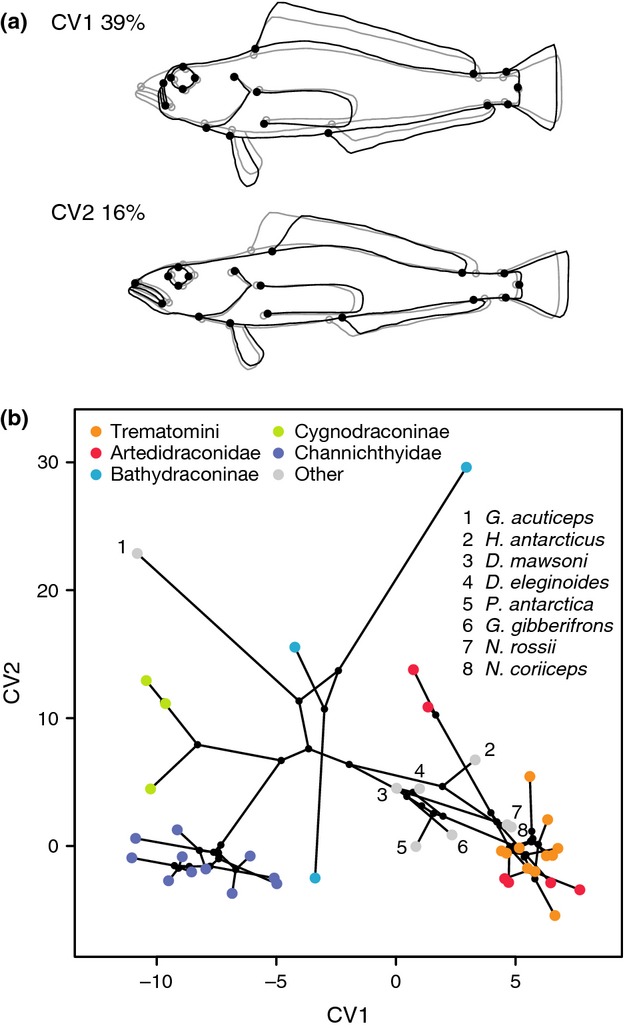
Figure 2.

Body shape variation in notothenioid species. (a) Shape changes along the first two canonical variates. (b) Phylomorphospace plot of the first two canonical variates of body shape variation. Coloured dots show mean values of notothenioid species, whereas dot colour indicates clade membership. Colour code as in Fig.1a. Species not assigned to clades are represented by gray dots, with labels indicating species names. Black lines show phylogenetic relationships, and black dots represent hypothesized ancestral trait values.
