
FIG 2.
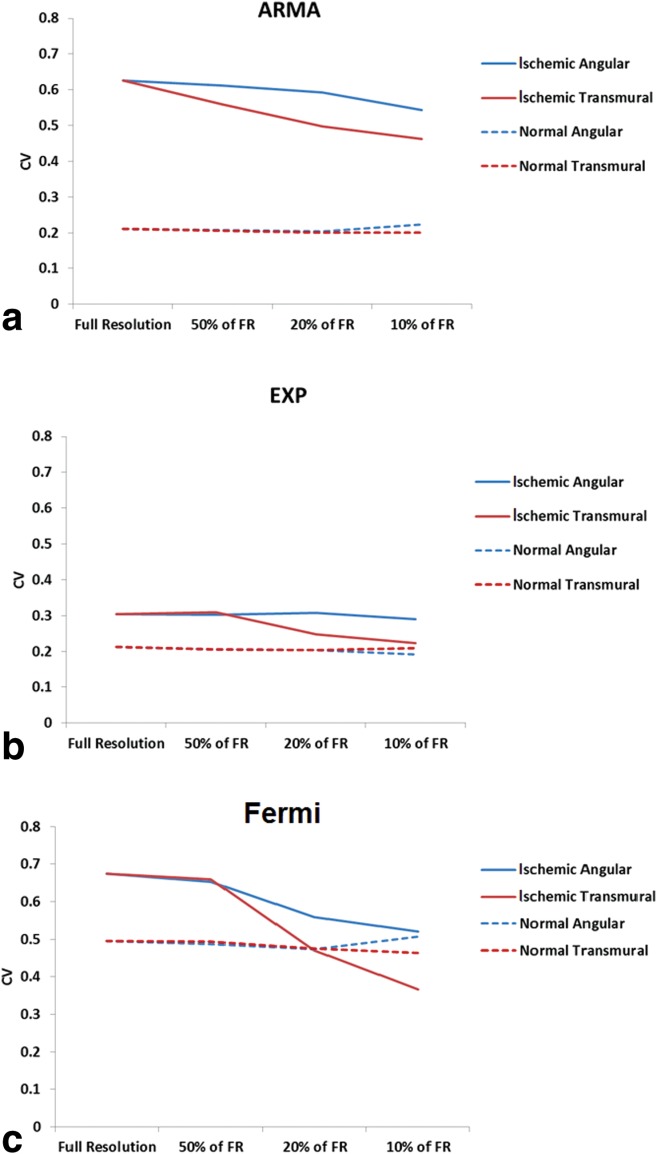
MBF estimates CV for ischemic (solid line) and normal regions (dashed line) in a group of patients is represented as a function of spatial resolution for ARMA, exponential, and Fermi model is represented in (a),(b), and (c), respectively. Differences were observed comparing ischemic regions CV at transmural and angular direction for all three deconvolution methods. This was more evident for Fermi function modeling. For the remote regions, however, the CV remained almost constant for both averaging directions for all methods.