
FIG 4.
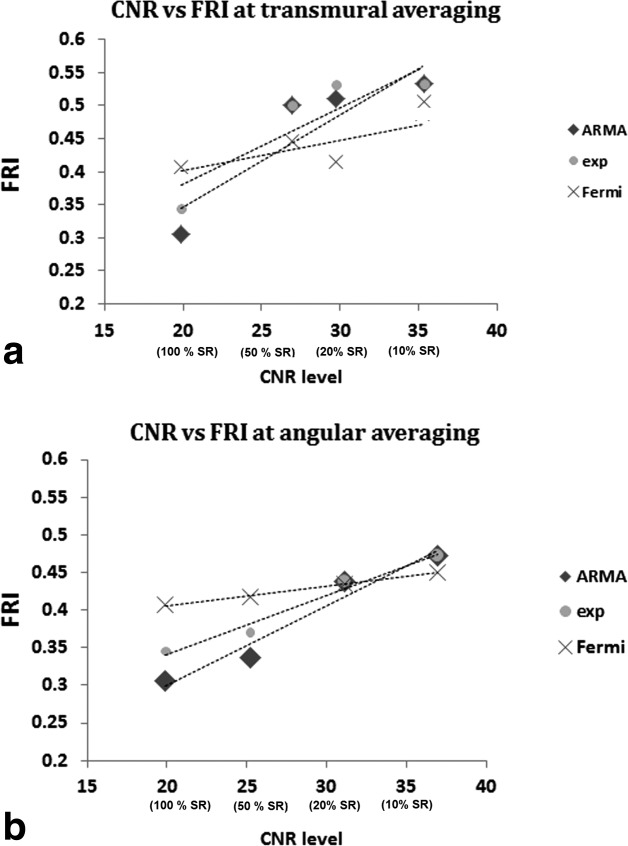
Scatter plot representing the FRI versus CNR level for spatial averaging at (a) transmural and (b) angular direction. CNR level of 20–40 corresponds to FR data to data with 10% spatial resolution (SR), respectively. FRI has increased for all methods in both direction of spatial averaging as CNR improves. Although spatial averaging of the data results in increase of the CNR level and reduction in the error introduced by noise, it will affect the accuracy of quantification by leaving useful information unmodeled. At FR level (CNR = 20) ARMA was the most accurate method among all. At CNR = 35 (segmental analysis), all method had almost similar accuracy.