
FIG 5.
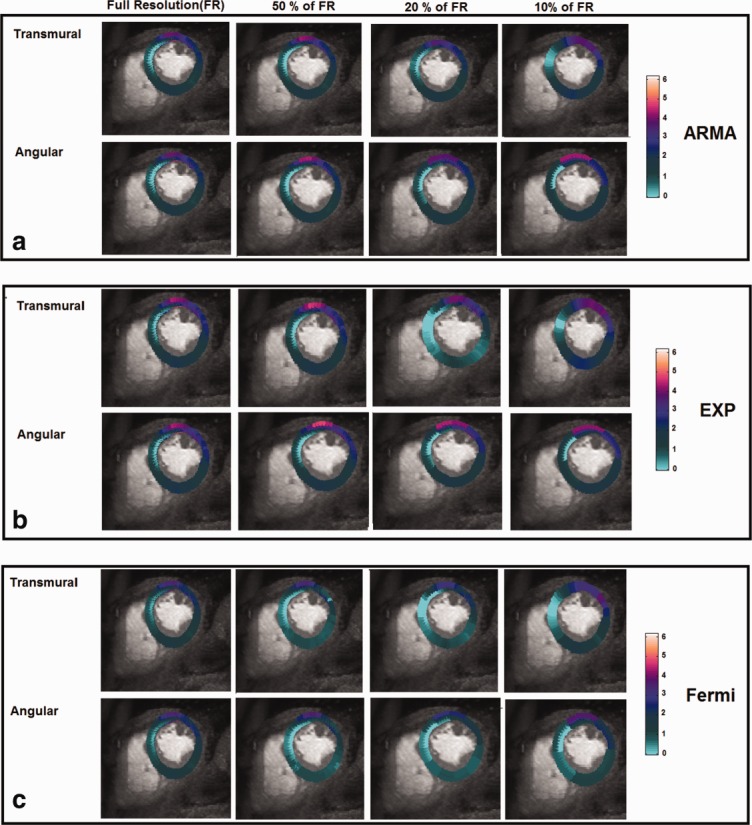
Perfusion maps of a patient with LAD disease for the mid-cavity slice obtained by (a) ARMA, (b) exponential, and (c) Fermi deconvolution. The perfusion maps are represented as function of spatial resolution level and direction of spatial averaging. Perfusion estimates are in mL/g/min. Transmural perfusion variations across the myocardium wall in ischemic regions have been disappeared at 20 and 10% of original resolution in transmural direction averaging for exponential and Fermi methods. However, for angular direction averaging, the endocardium, epicardium, and their transmural perfusion differences are still distinguishable from each other at 20 and 10% resolution levels in ischemic regions.