
Figure 2.
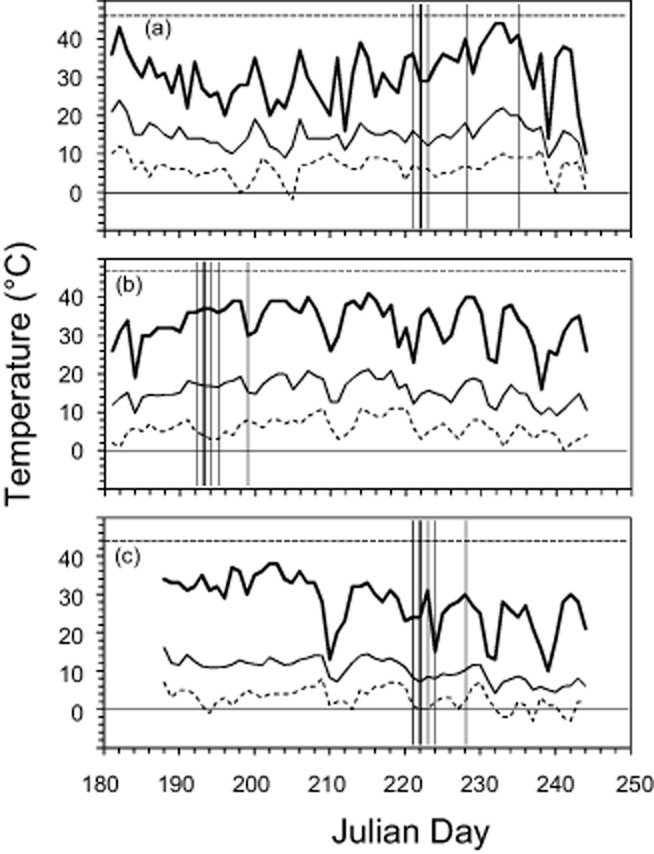
Leaf temperatures recorded in the alpine and nival plant species investigated during the summers of 2012 and 2013. (a) Rhododendron ferrugineum (1960 m.a.s.l.; 2012), (b) Senecio incanus (2165 m.a.s.l.; 2013), (c) Ranunculus glacialis (2560 m.a.s.l.; 2013). Data were collected in 1 min intervals using thermocouple sensors mounted onto the lower surface of leaves (n = 5 per species). The curves represent half-hour mean values (HHM) based on calculations of high resolution data (taken each minute). Bold lines, daily maximum HHM; regular lines, daily mean HHM; dashed lines, daily minimum HHM. The temperature thresholds of 0 °C (solid horizontal bar) and LT5, the temperature at which first heat-induced leaf injuries (5% of the total leaf area) were observed (dashed horizontal bar), were also shown. Vertical lines indicate the dates of the controlled heat treatment (bold) and days on which gas exchange measurements were recorded.