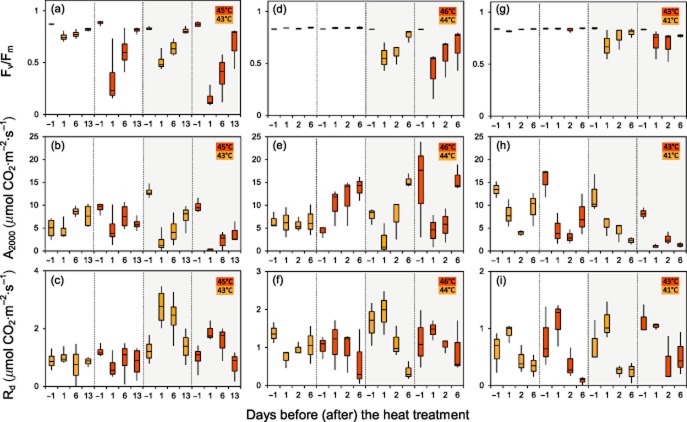
Figure 3.
Impact of sublethal heat treatment applied in situ on gas exchange and various photosynthetic parameters. Parameters were derived in situ from photosynthetic light response curves before and after the controlled heat exposure in the heat tolerance testing system (HTTS). Different heat exposure modes are seperated by vertical dotted lines. Left column (a–c) Rhododendron ferrugineum (Mt. Patscherkofel, 1960 m.a.s.l., 9 August 2012), middle column (d–f) Senecio incanus (Mt. Patscherkofel, 2165 m.a.s.l., 11 July 2013) and right column (g–i) Ranunculus glacialis (Ötztal Alps, 2560 m.a.s.l., 11 August 2013). Boxplots show the time courses of the potential PSII efficiency, Fv/Fm (a, d, g), of the photosynthetic CO2 assimilation rate at a PPFD of 2000 μmol photons·m−2 s−1, A2000 (b, e, h), and of the dark respiration rate, Rd (c, f, i). The four boxes within each heat exposure mode (from left to right) represent the control value 1 d before (−1) the heat treatment followed by the values during recovery from the heat treatment. Different colours (orange, red) of boxes indicate different exposure temperatures. White background, heat treatment in the light mode; grey background, heat treatment in the dark mode.

