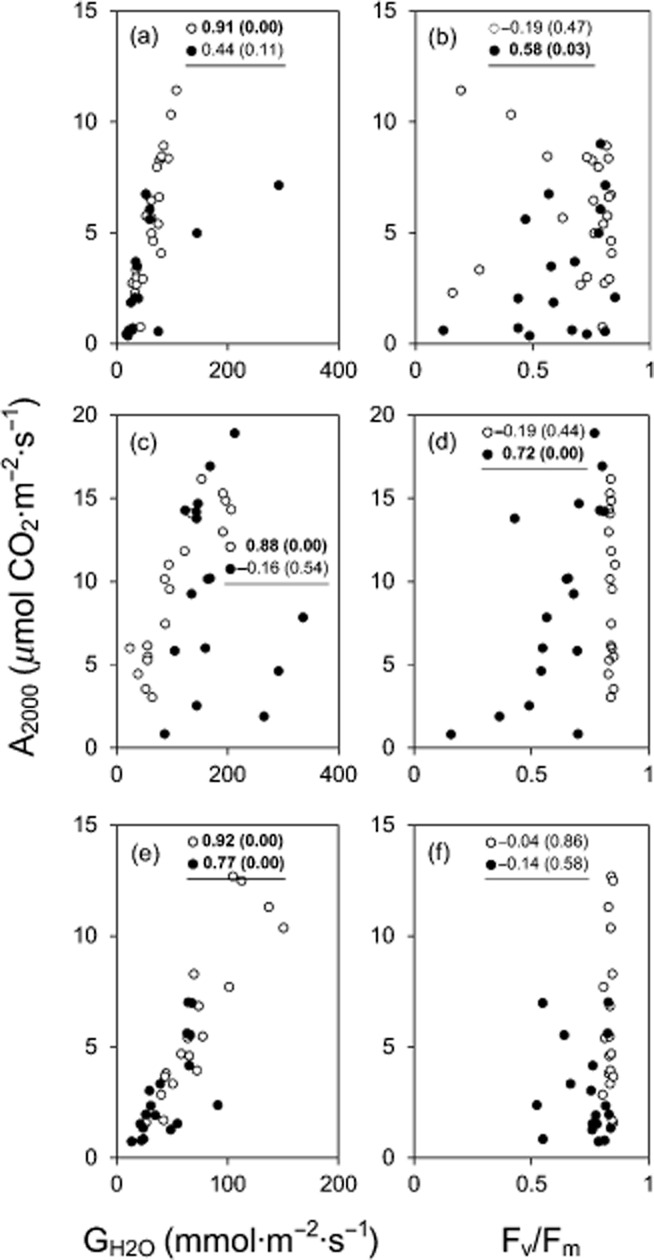
Figure 4.

Photosynthetic performance following sublethal heat stress. Correlation diagram between the assimilation rate at 2000 μmol photons·m−2 s−1, A2000, and (left column) the diffusive conductance GH2O at PPFD 2000 μmol photons·m−2 s−1 and (right column) Fv/Fm for 1, 2 and 6 d after controlled heat treatment at two different sublethal temperatures in the dark mode (solid circles) or in the light mode (open circles). (a, b) Rhododendron ferrugineum, (c, d) Senecio incanus, (e, f) Ranunculus glacialis. Numbers: Correlation coefficient (Spearman's Rho) and significance of the correlation (values in parentheses). Significant correlations are indicated in bold letters.
