
Figure 6.
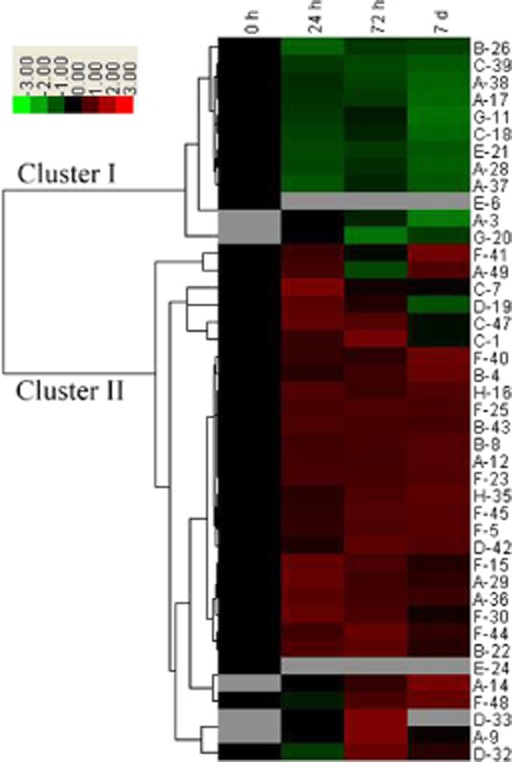
Hierarchical clustering analysis of the expression profiles of the 42 identified proteins. The four columns represent different NaCl treatments; columns 1, 2, 3 and 4 represent treatment for 0 h, 24 h, 72 h and 7 d, respectively, with 200 mm NaCl. The rows represent individual proteins. The protein cluster is on the left side, and the treatment cluster is on the top. The up- and down-regulated proteins are indicated in red and green, respectively. The grey boxes indicate proteins that were not detected on the 2-DE gels. The intensity of the colours increases with increasing expression differences, as shown in the legend. The protein spot numbers are listed on the right, and the letters before the spot numbers represent various functional categories of the proteins: A, photosynthesis; B, carbohydrate and energy metabolism; C, translation and transcription; D, amino acid metabolism; E, protein folding and degradation; F, stress and defence responses; G, metabolism; H, cell structure.