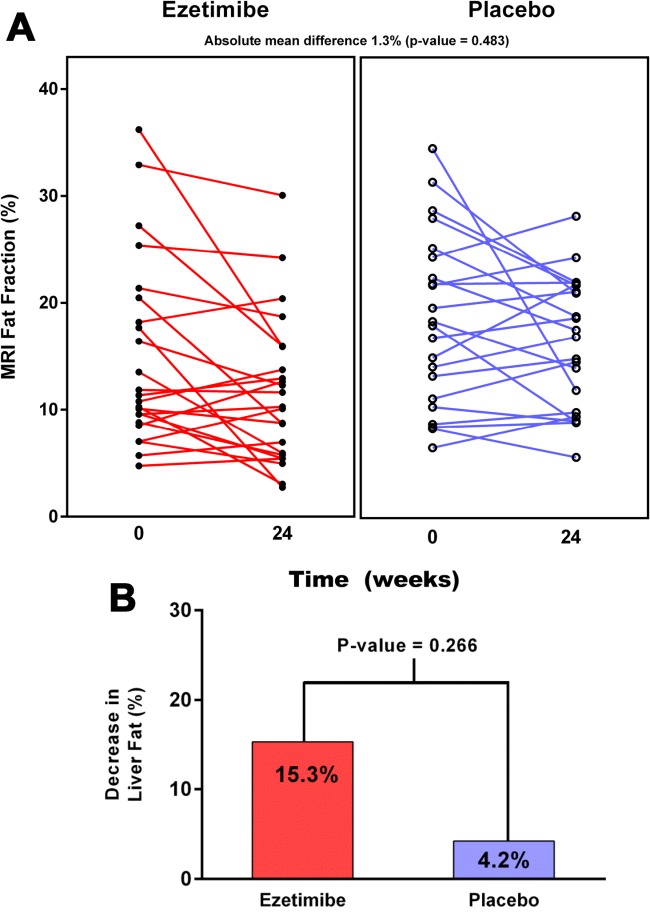
Figure 1.

(A) Individual patient data on liver fat content as assessed by MRI-PDFF before randomization and at the end of 24 weeks stratified by the treatment group assignment (ezetimibe-treated patients are to the left and shown by red lines, and placebo-treated patients are to the right and shown by blue lines). There was no significant difference in the changes in MRI-PDFF between the treatment groups (P = 0.483). (B) Percentage decline in liver fat relative to baseline by MRI-PDFF stratified by the treatment group assignment (ezetimibe-treated patients are to the left and shown by the red bar, and placebo-treated patients are to the right and shown by the blue bar). There was no significant difference in the changes in MRI-PDFF between the treatment groups (P = 0.266).
