
Figure 2.
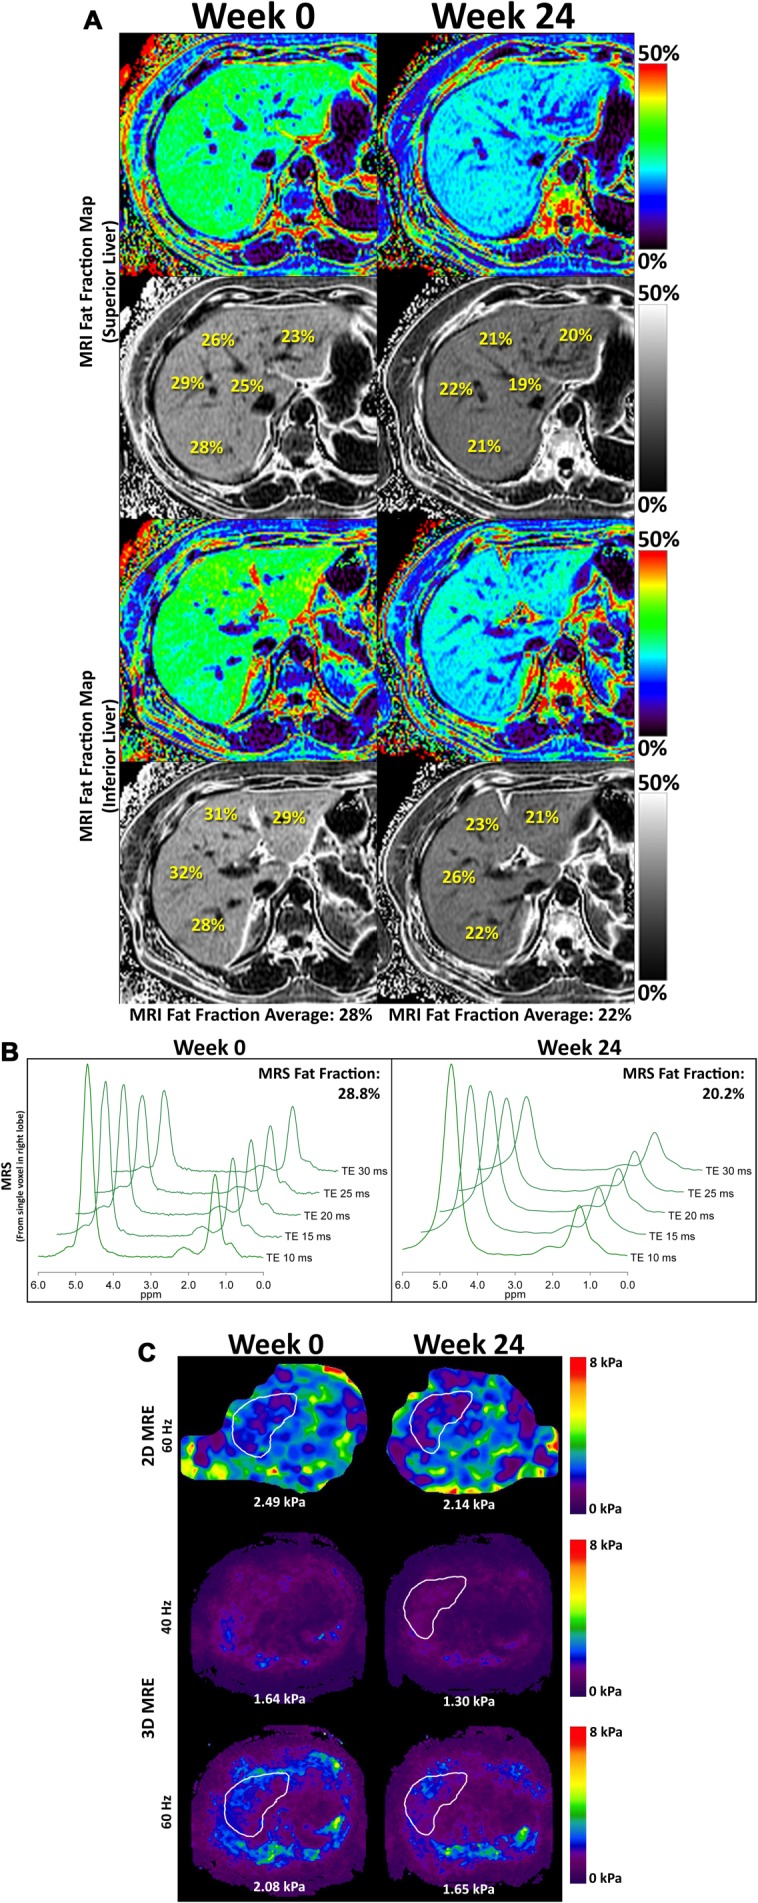
(A) Whole-liver fat mapping with MRI-PDFF for a single patient. MRI-PDFF measurements of liver segments 1, 2, 4a, 7, and 8 in the superior plane (upper panel) and of liver segments 3, 4b, 5, and 6 in the inferior plane (lower panel) are shown at weeks 0 (left column) and 24 (right column) for a patient. The fat fraction in a single liver segment is estimated by MRI-PDFF. Using nine ROIs, one in each segment, the calculated total liver fat fraction average at week 0 was 28%, and this decreased to 22% at week 24. MRI-PDFF data from all nine liver segments gives a fat map for the entire liver where longitudinal within-segment changes of liver fat can be appreciated. (B) MRS measured fat fraction in the same patient. MRS measurements from a 2 × 2 × 2 cm3 cube (voxel) within the right liver lobe of the same patient in which MRI-PDFF was performed are shown at week 0 (left column) and week 24 (right column). The corresponding MRS fat fraction at week 0 was 28.8%, and this decreased to 22% at week 24. (C) Liver stiffness measured by 2D and 3D MRE in the same patient. The 2D MRE was done at 60 Hz, and the 3D MRE was done at 40 Hz and 60 Hz. The MR shear wave elastograms obtained at week 0 are shown to the left, and those at week 24 are shown to the right. All three shear wave elastograms showed a decrease in the elasticity of the liver.