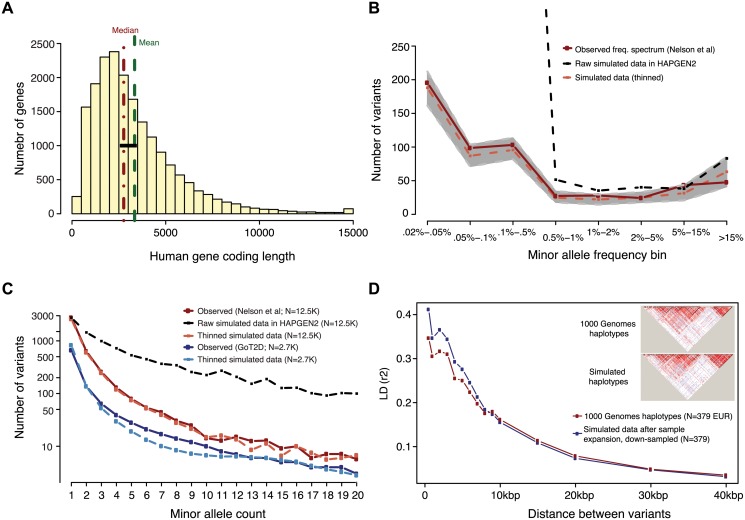
Fig 1. Generation of simulated genotype data at human gene loci in large sample sizes with HAPGEN2.
Haplotypes were simulated at ‘average’ human protein-coding genes drawn from the center of the distribution of RefSeq gene total exon length (A). Vertical dotted lines in red and green indicate the median and mean values of exon length, respectively. Black bar represents the 24 genes selected for simulation. (B,C) Site frequency spectrum of simulated data, as compared to observed human data. Data were simulated via staged expansion of 1000 Genomes Project haplotypes using the HAPGEN2 software; the mutation parameter was fit to match the site frequency spectrum of protein-coding variation observed in exome sequencing studies, e.g. as reported Nelson et al 2012. Raw simulated data from HAPGEN2 in large sample sizes produced an excess of rare sites; these were down-sampled to match observed data. The grey area in (B) represents the [5%, 95%] interval across all simulated genes, obtained using bootstrapping. The site frequency spectrum of simulated data in a smaller sample size (N = 2.7K) also matched an independent set of observed exome sequencing data from the GoT2D consortium (C). Haplotype structure, as measured by linkage disequilibrium between variants, was also preserved in the simulated data after sample expansion (D). The inset shows a representative example of simulations at the GATA3 gene locus.

