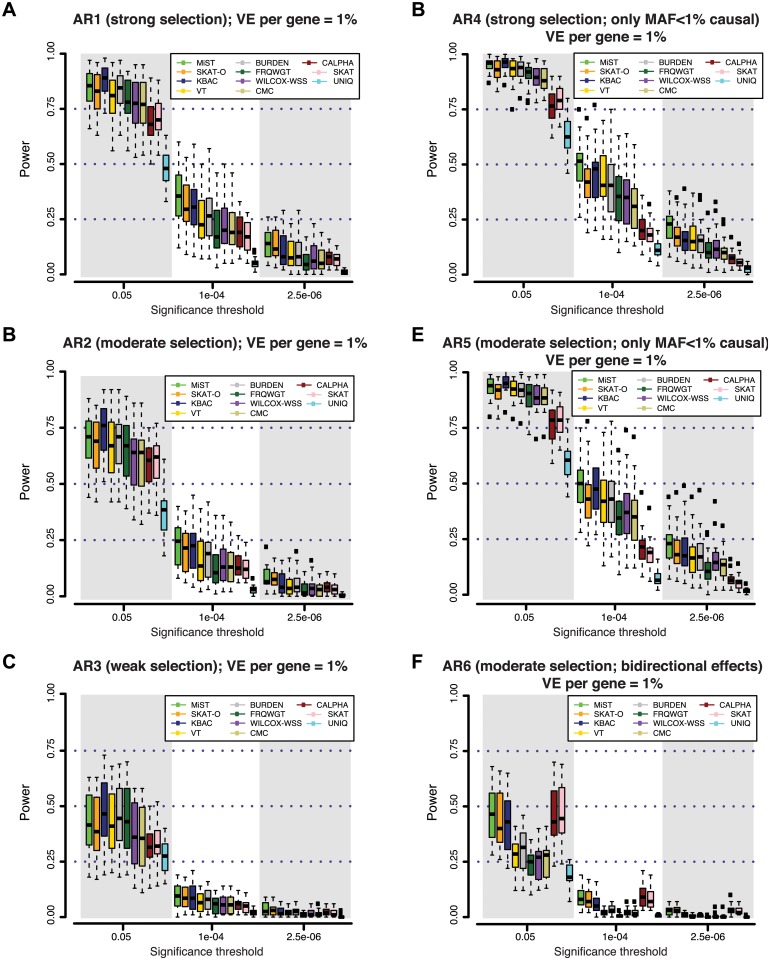
Fig 2. Power of different gene-based rare variant association methods at simulated disease loci.
At each gene locus, one hundred independent simulations of phenotypic effects were generated in a sample size of 3K individuals (1.5K cases / 1.5K controls). Variant effects were drawn from varied models of genetic architecture (A-F), hypothesizing different degrees of purifying selection against disease alleles (see Methods). Under models with strong selection, there is a strong inverse correlation between variant frequency and effect size; under weak selection rare variant effects are less skewed. At all loci, genetic variants together contribute 1% of the phenotypic variance underlying a trait with common prevalence (8%; modeled as type 2 diabetes). Power is measured as the fraction out of 100 simulations of each gene in which a gene-based test reported a p-value lower than the significance threshold. In (A-C), causal variants span the full frequency spectrum (including common alleles), and thus rare alleles account for only a fraction of the locus heritability; in (D-E), all causal variants are rare (MAF<1%). In (F), causal variants have bi-directional effects (some increase risk of disease, while others reduce risk).

