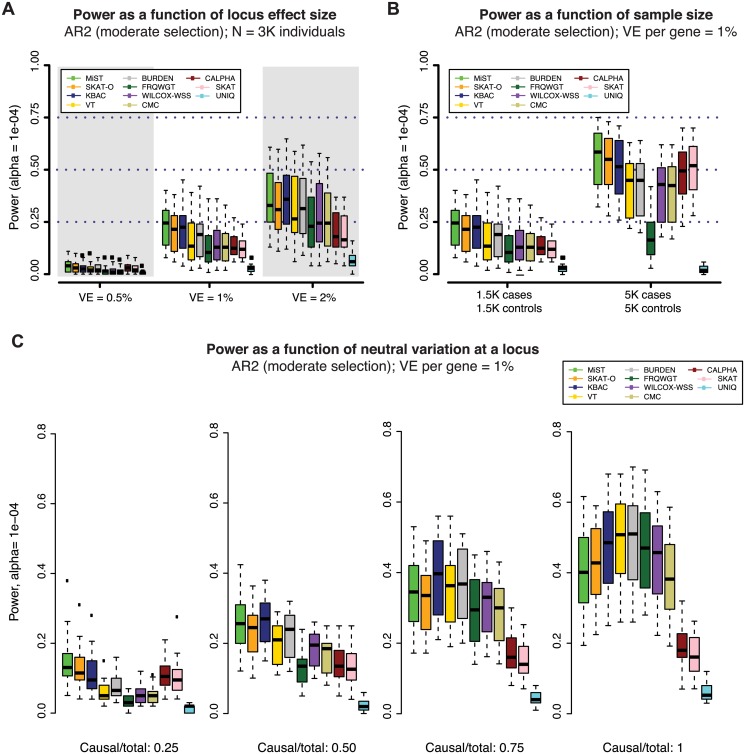
Fig 4. Power of gene-based methods as a function of sample size, locus effect size, and neutral variation.
Power was measured across one hundred simulations at each of 24 gene loci (as in Figs 2 and 3). Across all panels above, variant effects were drawn from the architecture model AR2 (assuming moderate selection against causal variants, and thus modest inverse correlation between variant frequency and effect size). In (A), variant effects were sampled at each locus such that the total fraction of phenotypic variance explained by the locus was ~0.5%, 1% (as in Figs 2 and 3) or 2%. In (B), loci were simulated to explain 1% of phenotypic variance in sample sizes of 1.5K cases/1.5K controls (as in Figs 2 and 3) and 5K cases/5K controls. In both (A) and (B), all exonic variants with MAF < 1% were included in the burden test (both causal and non-causal variants, resulting in a fewer than 50% of all tested variants being causal). In (C), non-causal (neutral) variants were selectively removed such that the ratio of causal variants to total variants tested ranged from 0.25 to 1 (only causal variants tested). The gene-based methods each have varied performance under different locus effect sizes, sample sizes, and causal variant filtering scenarios.

