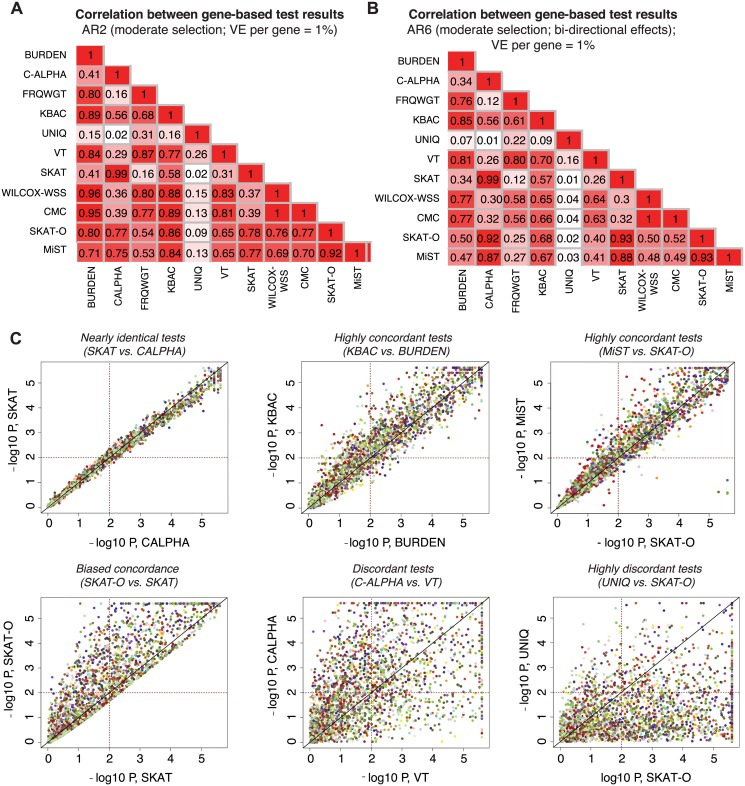
Fig 5. Concordance between results of different gene-based methods.
Pairwise correlation coefficients (R2) between the p-values reported by different gene-based association methods under AR2 (moderate selection; shown in (A) and under AR6 (moderate selection and bi-directional phenotypic effects, shown in (B)). P-values above 0.1 are excluded in computation of the correlation. In (C), scatter plots show the results (-log10 of the p-values) reported by a pair of gene-based tests under AR2; p-values below 5e-06 are plotted at 5e-06. Each point represents an individual locus at which both gene-based methods were applied (2400 total points); points of the same color represent different simulations at the same gene loci (e.g. same gene and haplotype structure, but different variant phenotypic effects). Dotted lines mark p = 0.01, such that points above the horizontal line or to the right of the vertical line represent loci at which nominally significant results are reported by the gene-based method. All data above generated in 3K samples (1.5K cases, 1.5K controls).

