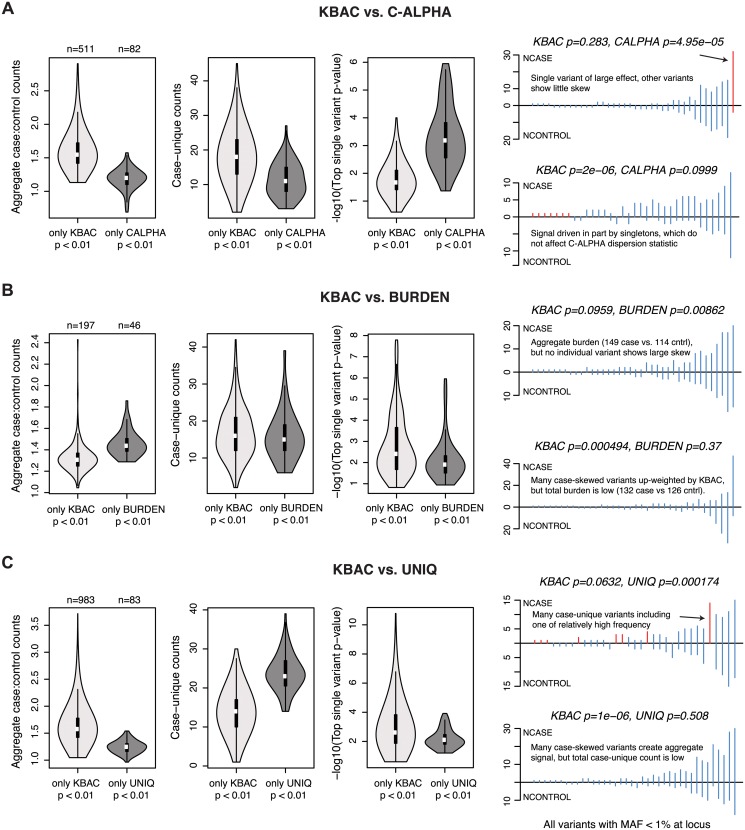
Fig 6. Properties of loci at which gene-based methods report discordant results.
Characteristics of causal loci at which KBAC (the method with highest mean power at nominal levels of significance) produces discordant results as compared to another gene-based method. Results are shown above for the simulated architecture AR2 in 3K samples. KBAC is compared to the (A) C-ALPHA, (B) BURDEN, and (C) UNIQ gene-based methods. In each comparison, loci are identified at which KBAC (but not the other method) reports a p-value < 0.01, or at which the other method (but not KBAC) reports a p-value < 0.01. For each group of loci, leftmost vioplot shows the distribution of aggregate case:control counts (number of minor alleles observed in cases divided by number of minor alleles observed in controls, for variants with MAF<1%). Middle vioplot shows distribution of case-unique counts (number of observations of alleles that are only present in cases and absent from controls). Rightmost vioplot shows distribution of the top single variant p-value observed for an exonic variant at the locus (log10 scale). Line plots at right show the distribution of variants (MAF < 1%) at representative simulated loci where the methods are discordant. Each line represents a variant; height above line measures the variant’s case counts, while height below measures control counts. Red lines highlight variants which drive the difference in test performance.

