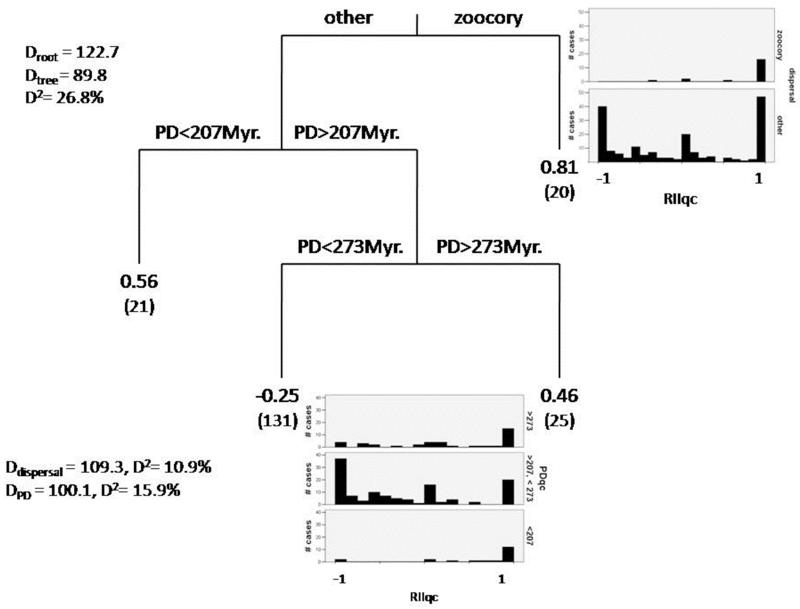
Figure 3.
Regression trees conducted with the interaction intensity index when Quercus coccifera was a nurse (RIIqc). Split values for each predictor used that became significant (dispersal and PD) are shown in each branch. Terminal nodes show the mean value of RII for each group and the number of cases in each node (between parenthesis, n = 197 cases). The general fit of the model (D2, percentage of variance explained by the model), the percentage of variance explained by each predictor, extracted from the null deviance (Deviance root), and the deviance of the final chosen tree after a 10-fold cross-validation (Deviance tree) are shown. To aid with the interpretation of these results, the histogram of frequencies of the RII values for each splitted value of the significant predictors is included in the figure. Please, notice that the histograms were constructed only with the cases remaining from the previous splits (i.e. for the histogram of RII divided by PD intervals, only species dispersed by mechanisms other than zoochory were included).

