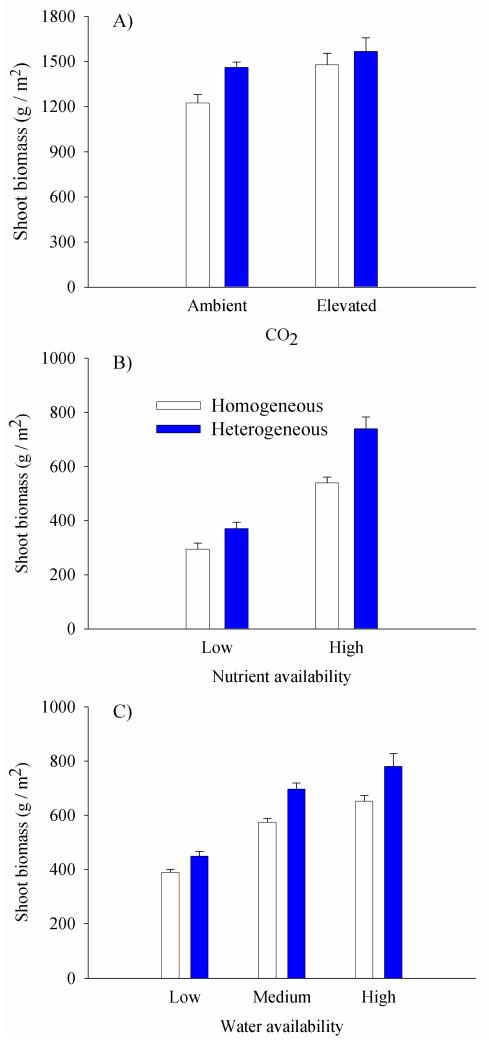
Figure 1.
Shoot biomass of experimental grassland communities compared across soil nutrient heterogeneity levels and atmospheric CO2 (A), nutrient availability (B) as a measure of N enrichment, and water availability (C) as a measure of changes in rainfall regime. (A) Consisted of two levels of atmospheric CO2: ambient (37.5 Pa) and elevated (70 Pa). (B) Consisted of two levels of nutrient availability: low (40 mg N) and high (120 mg N). (C) Consisted of three levels of water availability: low, medium and high (15.92, 31.84 and 47.76 L / m2 of water per week, respectively). Data are means + SE (n = 18 for data in A, n = 32 for data in B and n = 24 for data in C). Redrawn with permission from the New Phytologist Trust (A: Maestre, Bradford & Reynolds 2005), Global Change Biology (B: Maestre & Reynolds 2006b) and Ecology (C: Maestre & Reynolds 2007b).

