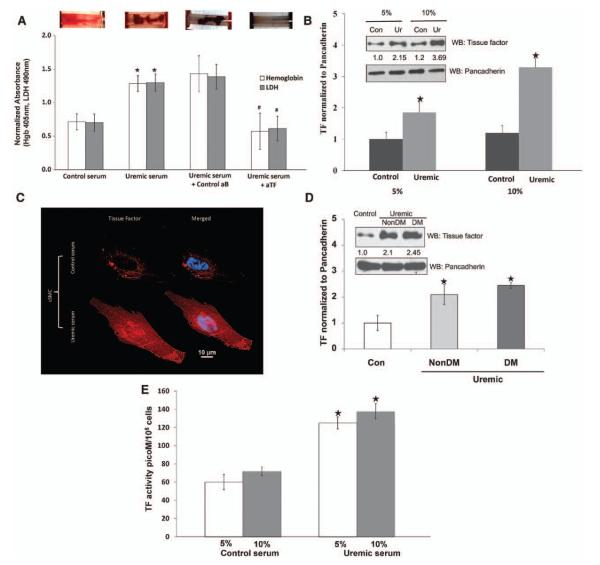
Figure 1.
Uremia is highly thrombogenic milieu increasing tissue factor (TF) expression and activity in vascular smooth muscle cells (vSMCs). A, Ex vivo thrombogenicity of uremic serum that is significantly abrogated by TF neutralization. Top, vSMCs grown on fibronectin-coated tubes were exposed to pooled 5% control or uremic serum for 24 hours. The tubes were then subjected to flow loop system with blood flowing on surface. A representative visual examination of clot after stopping the system is shown. Bottom, Hemoglobin (Hgb) and lactate dehydrogenase (LDH) values of the thrombus from the tubes treated with uremic serum and control serum are shown. Mean of 9 tubes is shown. *P<0.01 for hemoglobin and P<0.02 for LDH of uremic compared with control serum. Similarly, hemoglobin and LDH values of thrombus from the uremic serum–exposed tubes pretreated with control (control aB) or anti-TF neutralizing (aTF) antibody are shown. Mean of 6 tubes is shown. #P<0.01 for hemoglobin and P<0.02 for LDH of aTF compared with control antibody. Error bars=SEM. B, Uremic serum induces expression of TF. vSMC 1·105 cells seeded in 6-well plates and exposed to 5% and 10% of control (Con) and uremic (Ur) serum. Cell lysates prepared after 24 hours were immunoblotted for TF and pancadherin antibodies. Representative blot from 5 experiments is shown. Right, Densitometry analysis was performed on TF bands with ImageJ with the use of pancadherin to normalize the signal. Average of 5 experiments is shown. P<0.01 for 5% and P<0.005 for 10% uremic serum compared with control. Error bars=SEM. C, Immunofluorescence of TF in response to control and uremic serum. vSMCs treated for 24 hours with 5% control and uremic serum were fixed and stained for TF. Nuclei were stained with DAPI. D, Nondiabetic serum also increases TF expression. Cell lysates of vSMCs treated with 5% pooled control or nondiabetic or diabetic uremic serum were probed for TF and pancadherin. Representative blot of 3 experiments is shown. The TF band normalized with pancadherin. Average of 3 experiments is shown. P<0.02 for non–diabetes mellitus (DM) and P<0.01 for DM uremic serum compared with control. Error bars=SEM. E, TF activity increased with uremic serum. vSMCs 1·105 seeded in 6-well plates and exposed to 5% and 10% of control and uremic serum are shown. Cell lysates prepared after 24 hours were subjected to TF activity measurements. TF activity was normalized to number of vSMCs. Mean of 3 experiments performed in duplicate is shown. Error bars=SEM. WB indicates westernblot.

