
Fig 3. Relationship between tilt-induced Δ changes in the LFRR/HFRR ratio and HOMA-IR index in the whole group of obese subjects (insulin resistant, circles; non-insulin resistant, triangles).
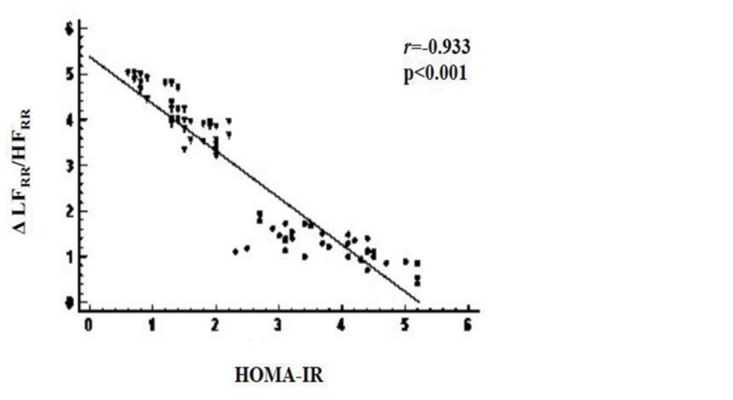
LFRR, low frequency power of R-R variability; HFRR, high frequency power of R-R variability; HOMA-IR, homeostasis model assessment of insulin resistance.