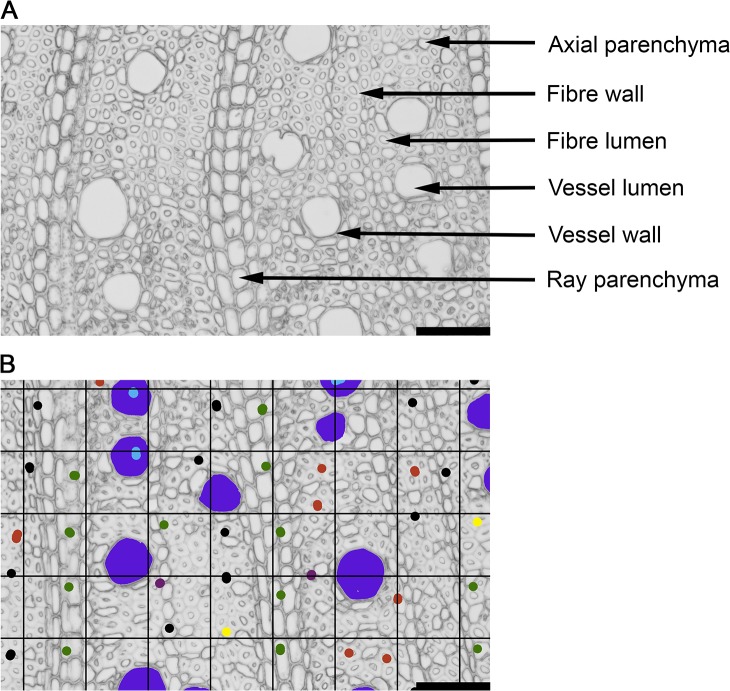
Fig 1. Illustration of wood tissues (A) and the image analysis method applied in this study (B), shown on an example of Gomphandra australiana, Icacinaceae.
(B) Vessels were manually coloured (large circles in dark blue) and then the vessel areas ware measured in image analysis software (see text for details). Grid method was used to estimate tissue fractions. Grid points were marked according to the tissue they fell in: light blue—vessel lumen, purple—vessel wall, red—axial parenchyma, green—ray parenchyma, yellow—fibre lumen and black—fibre wall. For clarity, the picture illustrates only a fragment of a larger, pie-shape area analysed. Scale bar corresponds to 100 μm.

