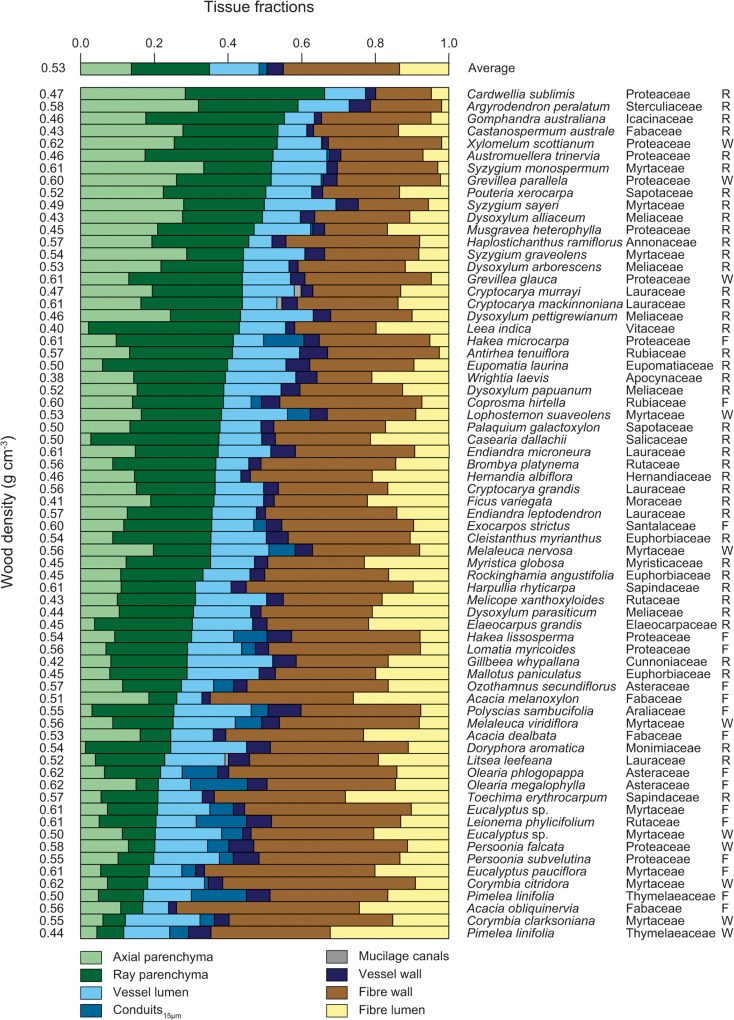
Fig 2. Stack bar graph of tissue fractions across 69 species.
Each bar represents an individual species with the top bar representing fractions averaged across all species. Species are sorted in order of decreasing total parenchyma fraction (axial + ray). Numbers on the left side indicate wood density of a given species. Species name, family, and site are given on the right side of the graph. Site codes stand for: R—tropical rainforest (Cape Tribulation), W—tropical woodland (Blencoe Falls) and F—temperate forest (Thredbo).

