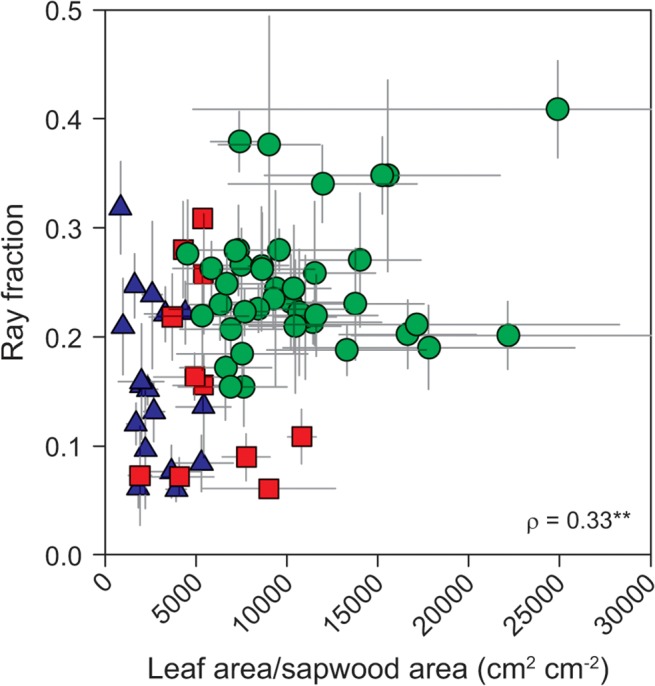
Fig 6. Relationship between ray fraction and leaf area to sapwood area ratio.

Green circles—tropical rainforest (warm and wet site); red squares—tropical woodland (warm and dry site); blue triangles—temperate forest (cool and wet site). ** P < 0.01.

Green circles—tropical rainforest (warm and wet site); red squares—tropical woodland (warm and dry site); blue triangles—temperate forest (cool and wet site). ** P < 0.01.