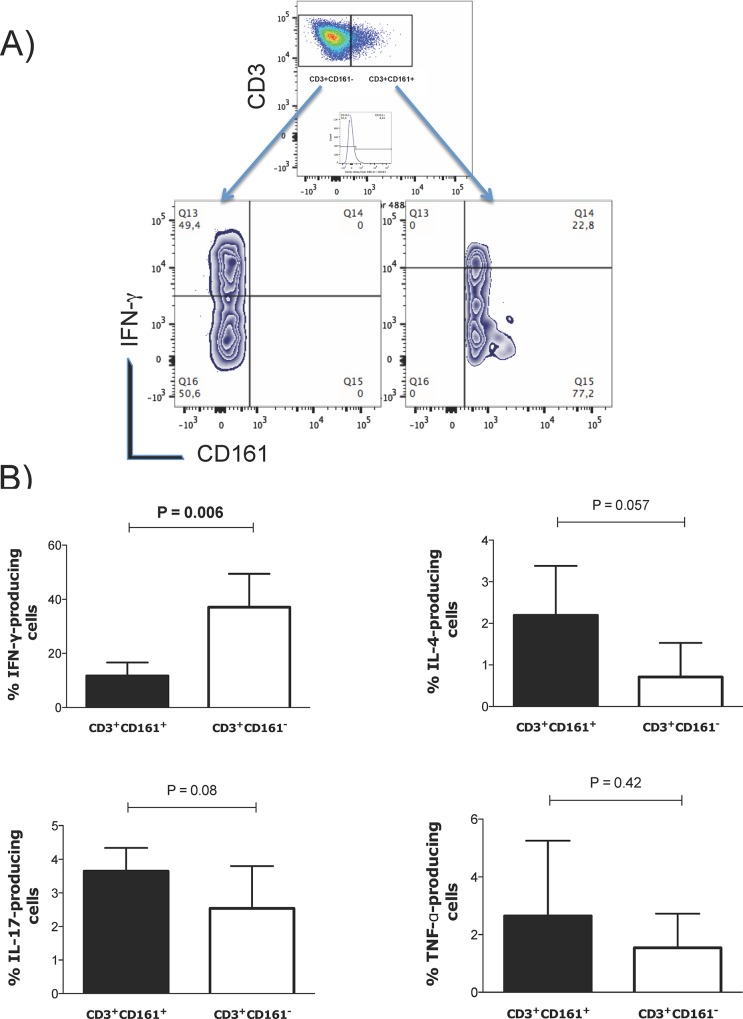
Fig 3. Functional profile of CD3+CD161+ and CD3+CD161- alveolar lymphocytes.
(A) Representative plots of flow cytometry analysis performed by selecting CD3+CD161+ or CD3+CD161- cells from the CD161 vs CD3 double plot or single histogram plot according to appropriate isotype control and evaluating the percentage of cytokine-producing cells within these gates. (B) Bar graphs representing the percentages of alveolar CD3+CD161+ and CD3+CD161- cells producing IFN-γ (n = 7), IL-4, IL-17 and TNF-α; n = 4. P values were generated using the Mann-Whitney test.

