
Fig 1. Circulating VWF levels decrease the clearance of rFVIII and rFVIIIFc.
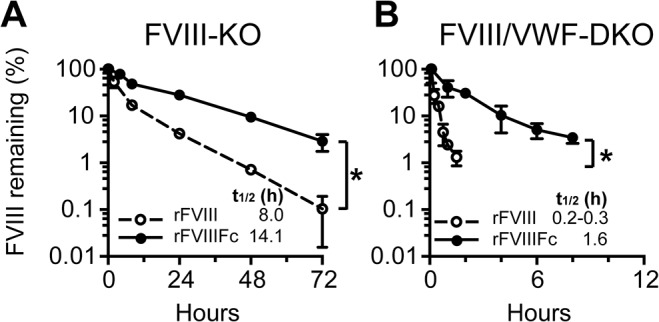
Plasma activity of rFVIII and rFVIIIFc versus time profile is shown for (A) FVIII-KO and (B) FVIII/VWF-DKO mice (note the time scale difference). Mice are dosed with 250 IU/kg rFVIII or rFVIIIFc and the FVIII activity remaining in plasma determined by the chromogenic activity assay (3–4 samples per time point, mean ± SD). Significance between plasma levels for individual time points on the PK curves is determined by an unpaired 2-tailed student t-test. A significant difference is indicated between PK curves with one or more significant time point differences (p<0.05).