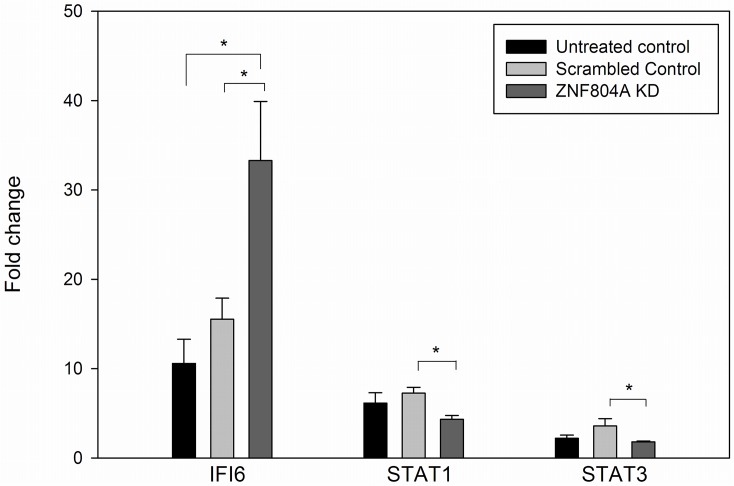
Fig 2. Induction of interferon-responsive genes.
NPCs were treated with IFNA2 (1mg/ml) for 4 hours, after which RNA was isolated and analyzed by qPCR. IFI6 and STAT1 increased with treatment, while STAT3 decreased. Fold changes were calculated as described in the methods section. Significant differences in the fold change were found in the comparison between the scrambled control and the ZNF804A KD line for all three genes using a Student’s t-test (all results two-tailed): IFI6, p = 0.03; STAT1, p = 0.004; STAT3, p = 0.05. No other significant differences were found for the other comparison, except for untreated control vs ZNF804A KD (p = 0.01). The bar graph represents the mean of 6 determinations (biological duplicates analyzed in triplicate) +/- standard error.

