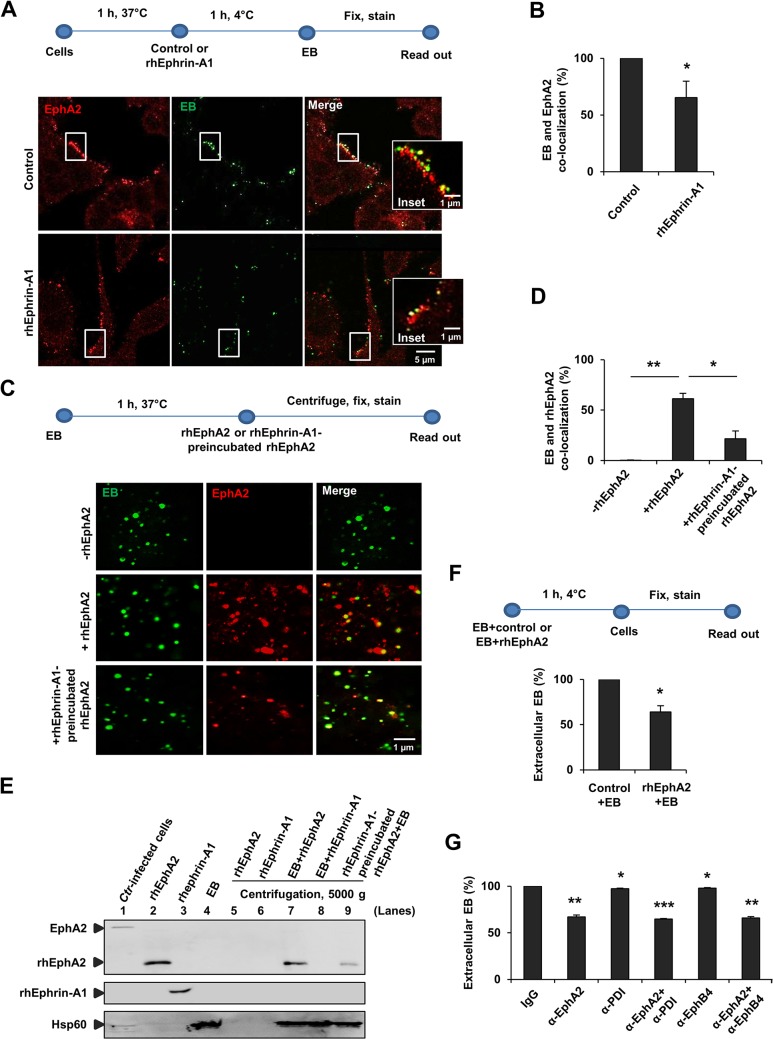
Fig 1. Interaction of EphA2 with Ctr-EB upon infection.
(A, B) HeLa cells were pretreated with control or rhEphrin-A1 (5 μg/ml) for 1 h at 37°C and infected with Ctr (MOI-100) for 1 h at 4°C. Cells were fixed and immunostained for Ctr (Hsp60, green) and EphA2 (EphA2, red). (A) Images show EphA2 or EB or the co-localization of EB with EphA2 (yellow) on the cell surface. (B) Co-localization of EB with EphA2 was quantified from 8 different fields of view in 3 independent experiments. The data are expressed as a mean percentage of EphA2-associated EB (± SD) compared to total EB. *P<0.05. Error bars show mean ± SD. (C, D) Purified EB was incubated with or without rhEphA2 (5 μg/ml) in a serum free RPMI media containing 0.1% BSA for 1 h at 37°C. Additionally, rhEphrin-A1-preincubated rhEphA2 was incubated with EB as above. The mixture was centrifuged onto coverslips, washed 3 times with ice cold-PBS, stained and quantified as (B). The data are expressed as a mean percentage of EphA2-associated EB (± SD) compared to total EB. *P<0.05, **P<0.01. Error bars show mean ± SD. (E) Pull-down assay: Purified EB was incubated with rhEphA2 or with rhEphrin-A1 each 10 μg/ml in a serum free RPMI media containing 0.1% BSA for 45 min at 37°C in a rotary shaker. Additionally, rhEphrin-A1-preincubated rhEphA2 was incubated with EB as above and the mixture was centrifuged at 5000 x g for 4 min at 4°C. The pellet was gently washed 3 times with ice cold-PBS. Ctr-infected cells act as a positive control for full length EphA2 expression. The samples were subjected to WB analysis to determine the full length endogenous EphA2 (~130 kDa) and rhEphA2 (~70 kDa) using N-terminal EphA2 specific antibody. rhEphrin-A1 was expressed at ~55–60 kDa. Hsp60 acts as a control for EB. (F) EB pre-incubated with rhPHB (PHB-His) (PHB is a mitochondrial inner membrane protein. rhPHB acts as a control for His-tagged rhEphA2) or with rhEphA2 (EphA2-His) each 5 μg/ml for 1 h at 4°C were added to HeLa cells for 1 h at 4°C. Cells were fixed and immunostained for extracellular EB and Actin filaments (Phalloidin). The number of extracellular EB was counted randomly from 40 different cells. Data are expressed as percentage of extracellular EB relative to control. Shown is the mean ± SD of three independent experiments normalized to control+EB. *P<0.05. Error bars show mean ± SD. (G) HeLa cells were incubated with antibody against N-terminal-EphA2 or-PDI or-EphB4 each 10 μg/ml for 1 h at 4°C. Cells were then infected with GFP-expressing Ctr for 1 h at 4°C. Cells were fixed and immunostained against Actin filaments. Graph was made similar to (F). Shown is the mean ± SD of two independent experiments normalized to IgG control. *P<0.05, **P<0.01, ***P<0.001. Error bars show mean ± SD. (A, C) Magnification is indicated in size bar.

