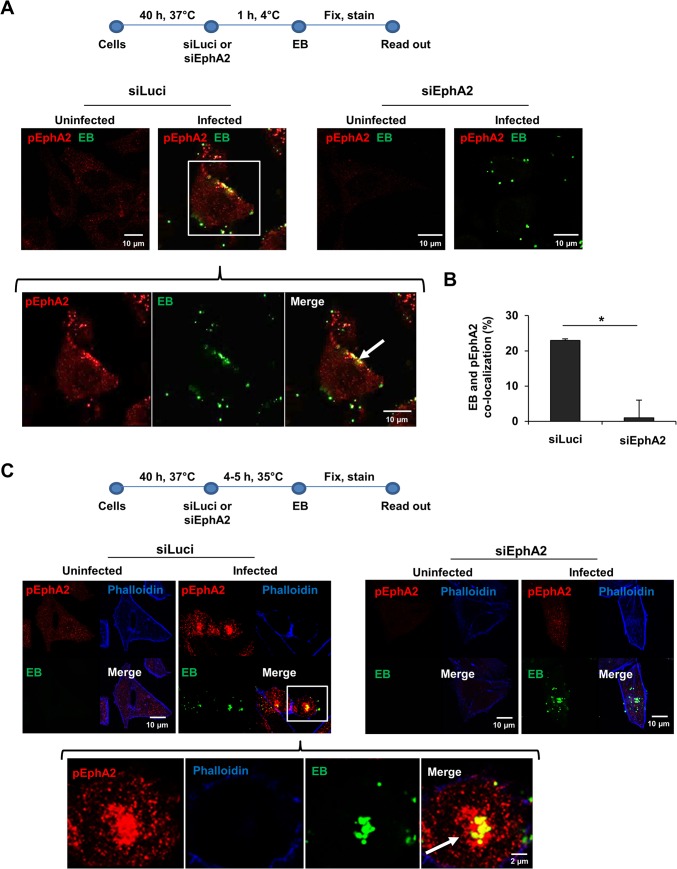
Fig 2. EphA2 activated upon early infection co-localizes with Ctr.
(A) Adherence assay: HeLa cells were transfected with siRNA against luciferase gene (siLuci) or EphA2 gene (siEphA2) for 40 h at 37°C. The transfected cells were infected with Ctr (MOI-100) for 1 h at 4°C followed by immunostaining Ctr-EB (Hsp60, green) and pEphA2 (phospho EphA2 Ser897, red). (B) Co-localization of EB with pEphA2 was quantified. The graph was made similar to Fig 1B. The data are expressed as a mean percentage of pEphA2-associated EB (± SD) compared to total EB. *P<0.05. Error bars show mean ± SD. (C) Invasion assay: The transfected cells were infected with Ctr (MOI-20-25) for 4–5 h at 35°C followed by immunostaining as (A) including Actin filaments. (A, C) Arrows indicate the co-localization of Ctr with pEphA2 (yellow). Magnification is indicated in size bar.

