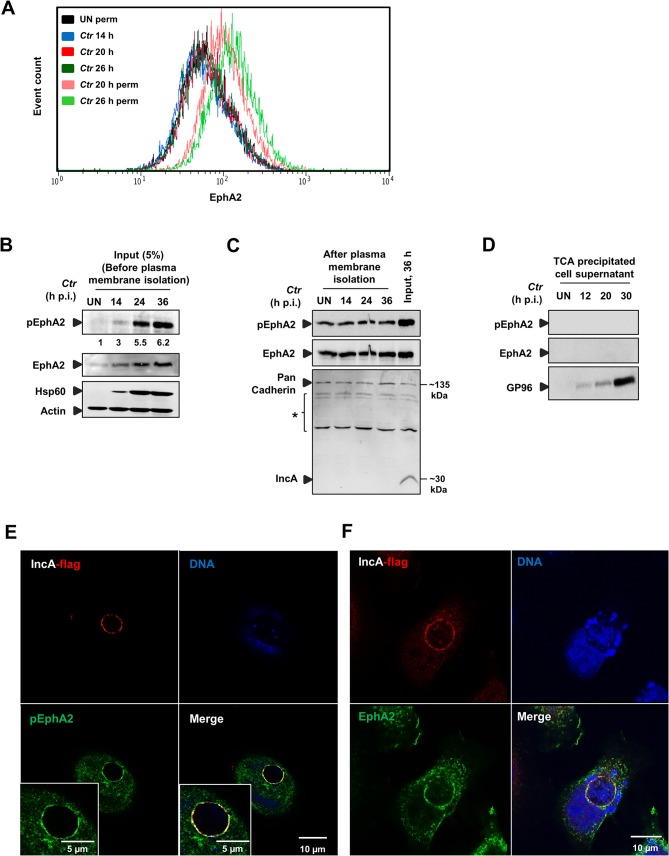
Fig 4. Ctr-induced EphA2 expression is prevented being re-translocated to the cell surface and is recruited to the inclusion membrane.
(A) HeLa cells were infected with Ctr-EB (MOI-1) for 14, 20 and 26 h and cells were analyzed via FACS as Fig 3A. (B) HeLa cells were infected with Ctr-EB for 14, 24 and 36 h. Input (5%) was taken after homogenization step (before plasma membrane protein isolation) and subjected to WB analysis to determine pEphA2, Hsp60 and Actin. The blot was stripped and reprobed for total EphA2. Numbers under the blot represents fold activation for pEphA2 with respect to total EphA2. (C) Plasma membrane protein was isolated from UN or Ctr-infected cells at different time points and subjected to WB analysis. Pan Cadherin was used as a control for plasma membrane. IncA was used as a marker to test the quality of the isolated plasma membrane. * Unspecific bands detected by IncA polyclonal serum. (D) Culture medium of the UN as well as time course Ctr-infected cells (as indicated) was collected and TCA precipitated. The precipitated lysates were subjected to WB analysis against pEphA2, total EphA2 and GP96. (E, F) HeLa cells were transfected with EphA2-pcDNA3 at 37°C and the cells were infected with Ctr-pIncA-flag for 24 h at 35°C. (E) Cells were fixed and stained against Flag (red), EphA2 (green) and DNA (blue). (F) Cells were fixed and stained against Flag (red), pEphA2 (green) and DNA (blue). Magnification is indicated in size bar.

