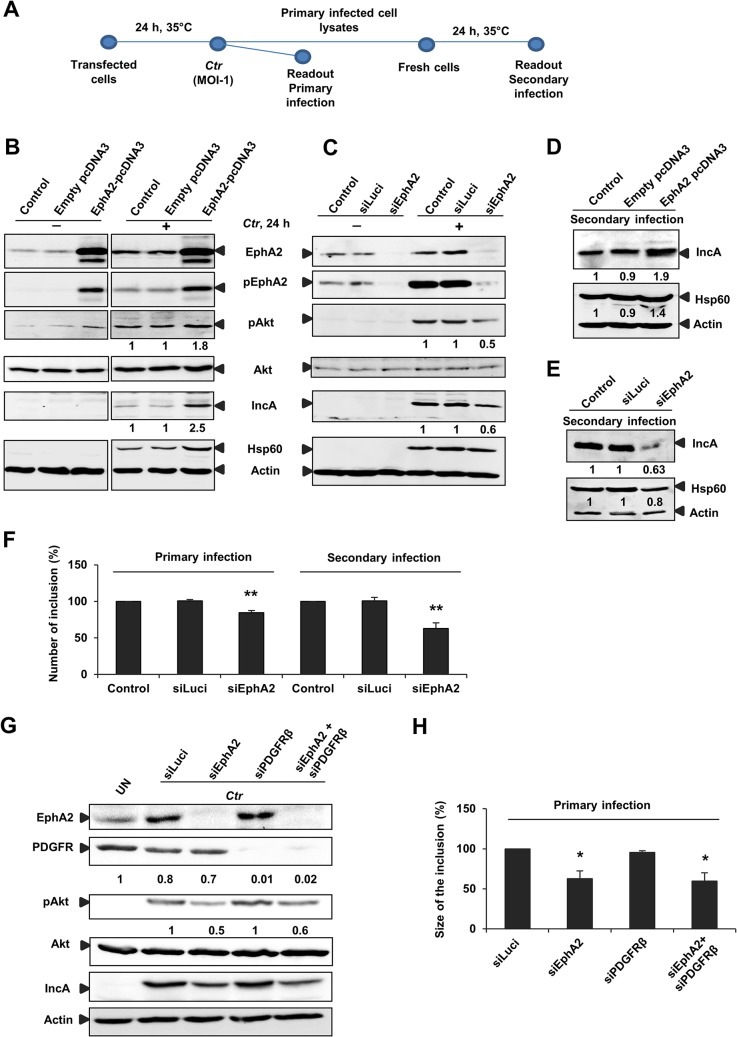
Fig 5. EphA2 overexpression and knockdown influences Ctr infection.
(A) Infectivity assay performed for B) C) D) E) F): The transfected cells infected with Ctr (MOI-1) for 24 h at 35°C was referred as primary infection. The supernatant of the primary infected cells was taken to infect the fresh cells to determine the secondary infection (see infectivity assay-methods). (B) HeLa cells were left untransfected (control) or transfected with empty pcDNA3 or EphA2-pcDNA3 each 1 μg/ml and then left UN or infected with Ctr for 24 h. Cells were harvested for WB analysis. (C) HeLa cells were untransfected (control) or transfected with siRNA against luciferase gene (siLuci) or EphA2 gene (siEphA2) for 40 h at 37°C and then left UN or infected with Ctr for another 24 h. Cells were harvested for WB analysis. (D, E) Primary infected cell lysates of (B) and (C) were taken to infect the fresh cells for secondary infection (Infectivity assay). (F) Number of the inclusion per cell (%) for the infectivity assay was determined by counting the inclusion on 10 independent fields. Shown is the mean ± SD of three independent experiments normalized to control. **P<0.01. Error bars show mean ± SD. (G) Cells were transfected with siRNA against luciferase (siLuci) or EphA2 (siEphA2) or PDGFRβ (siPDGFRβ) or both together for 40 h at 37°C and then infected with Ctr. UN: uninfected cells. Cells were harvested to determine the respective proteins by WB analysis. (H) Size of the inclusion per cell (%) for (F) was determined by ImageJ software by measuring cells out of four microscopic fields. Shown is the mean ± SD of two independent experiments normalized to siLuci. *P<0.05. Error bars show mean ± SD. In all of the above experiments, numbers under the blot represents fold activation for phospho specific proteins with respect to total proteins and fold change for the total proteins.

