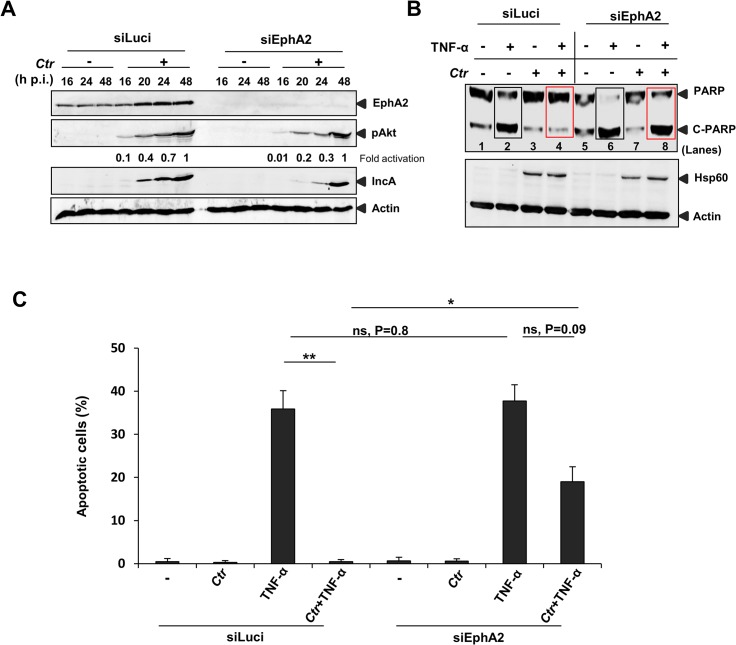
Fig 9. Ctr-infected cells were sensitized to TNF-α induced apoptosis upon EphA2 knockdown.
(A) The transfection efficiency of siRNA directed against EphA2 was monitored by WB analysis against total EphA2. In addition, levels of pAkt, IncA and Actin were verified. (B) siLuci or siEphA2-transfected cells were left uninfected or infected with Ctr for 16 h. Cells were induced to apoptosis by TNF-α (50 ng/ml)/CHX (5 μg/ml) for 5–6 h. Processing of PARP, Hsp60 and Actin were monitored by WB analysis. Rectangle boxes (black: before infection) or (red: after infection) denotes the difference in PARP cleavage after TNF-α induction in siLuci and siEphA2 transfected cells. (C) For quantification, TUNEL positive cells from each sample were counted from ten different fields. Shown is the mean ± SD of two independent experiments. **P<0.01, *P<0.05, ns: non-significant. Error bars show mean ± SD.

