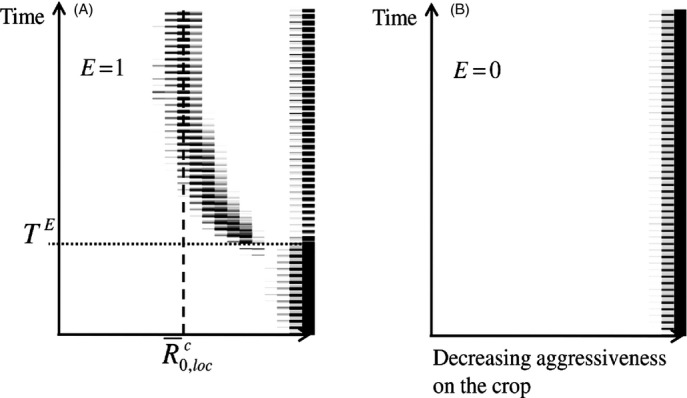
Figure A1.

Examples of global evolutionary trajectories in the pathogen population when the emergence of a crop pathogen is successful (A, E = 1) or not (B, E = 0). In A, the time that the emergence required (TE) and the mean aggressiveness of the stable pathogen population on the crop ( ) are also displayed. The grey intensity indicates the frequency of pathogen genotypes (x-axis) across time (y-axis), white: the frequency is equal to 0, black: the frequency is equal to 1.
