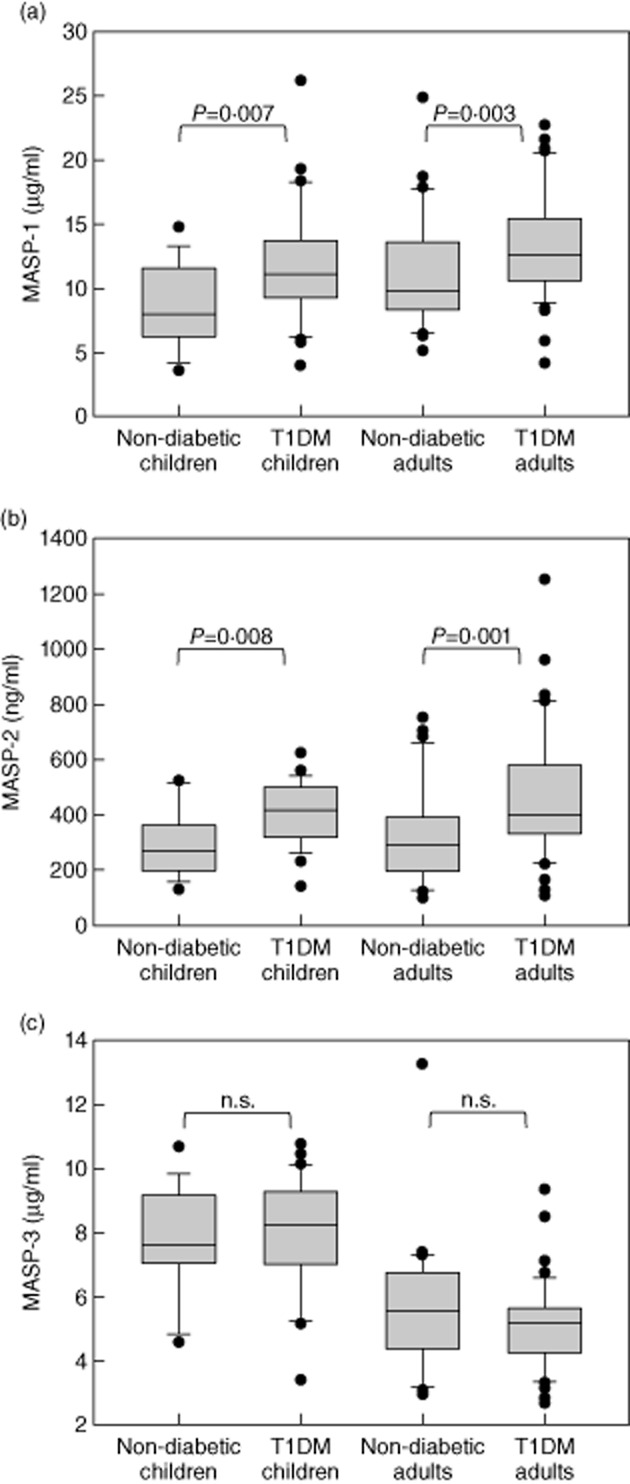
Fig 1.

Plasma levels of mannan-binding lectin-associated serine proteases (MASPs) in patients with diabetes and control subjects showing (a) MASP-1, (b) MASP-2 and (c) MASP-3 levels. Boxes represent median, 25th and 75th percentiles, whiskers show the 10th and 90th percentiles and dots are values outside these percentiles. Groups were compared using the Mann–Whitney U-test and the P-value is indicated; n.s. = non-significant.
