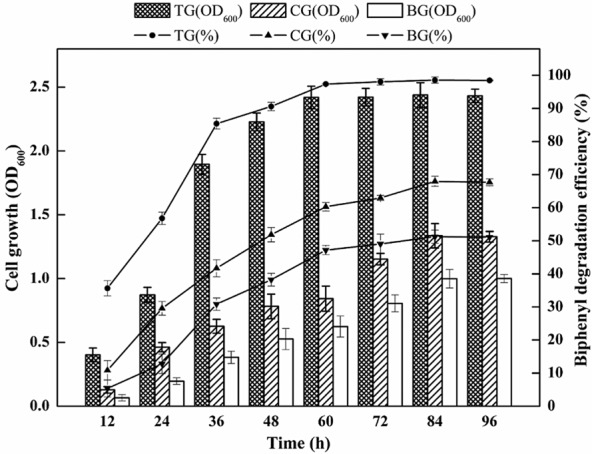
Fig 3.

Comparison of biphenyl-degrading curve among different enrichment cultures at a concentration of 1500 mg l−1. TG: addition of EOM; CG: addition of autoclaved EOM; BG: without EOM. Error bars indicate the standard deviations of triplicate samples.
