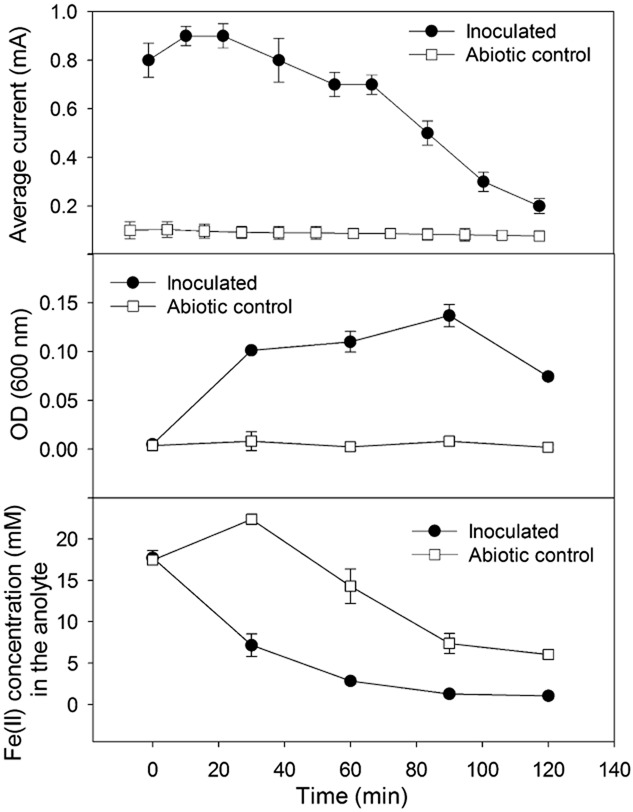
Fig 2.

Typical patterns of changes of the generated current (top), the optical density at the wavelength of 600 nm of the anode suspension (center), and the concentration of ferrous iron in the anolytes (bottom) during an operational batch of a MFC inoculated with bacteria in comparison with those of the abiotic control. The MFCs were operated with a 10 ohm external resistor at 25°C. Error bars represent standard deviations.
