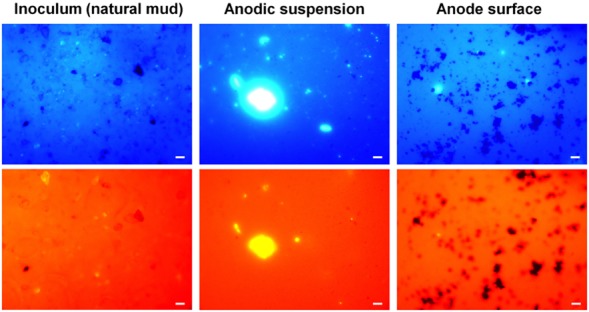
Fig 5.

FISH analyses of iron bacteria in the inoculum and in the anode suspension as well as on the anode surface of an inoculated MFC. Upper are images created from fluorescent signals of DAPI, with white dots showing the presence of all bacteria in the samples. Lower are images created from fluorescent signals of Cy3 attached to the probe PS1, with white dots showing the presence of iron bacteria in the samples. Bars, 5 μm.
