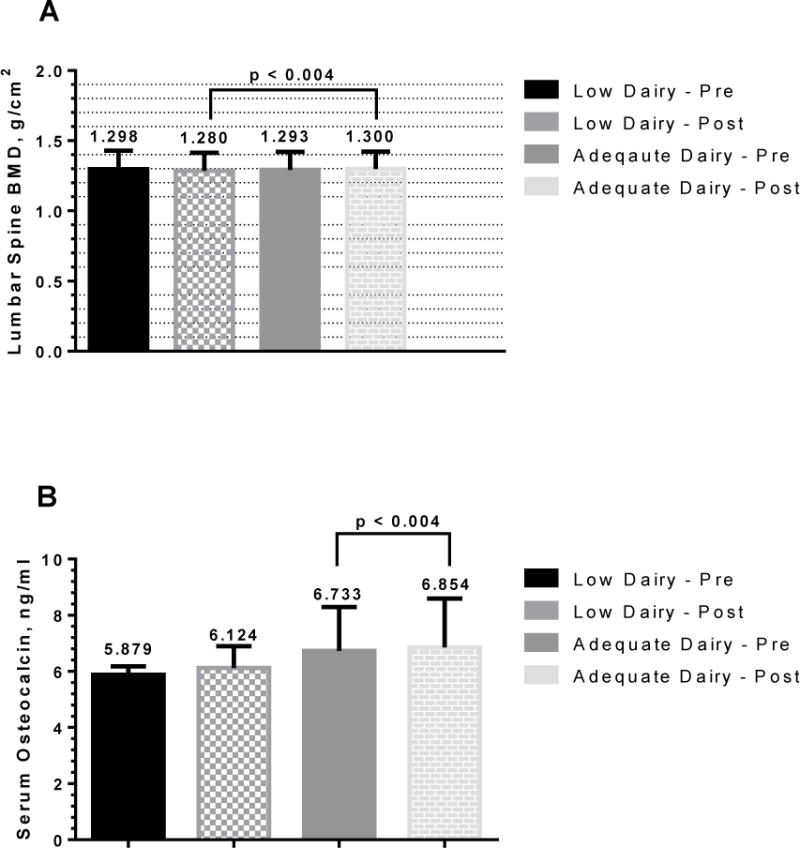
Figure 1.

Differences in Lumbar Spine Bone Mineral Density and Serum Osteocalcin by Treatment Group Post-Weight Loss
1A: Adequate Dairy (AD) group had significantly greater lumbar spine bone mineral density compared to the Low Dairy (LD) group following weight loss and after controlling for pre-weight loss levels using ANCOVA. Values are means ± SD.
1B: Serum osteocalcin (OC) was significantly higher in the AD group compared to the LD group after weight loss and controlling for pre-weight loss levels using ANCOVA. Values are means ± SD.
