
Figure 1.
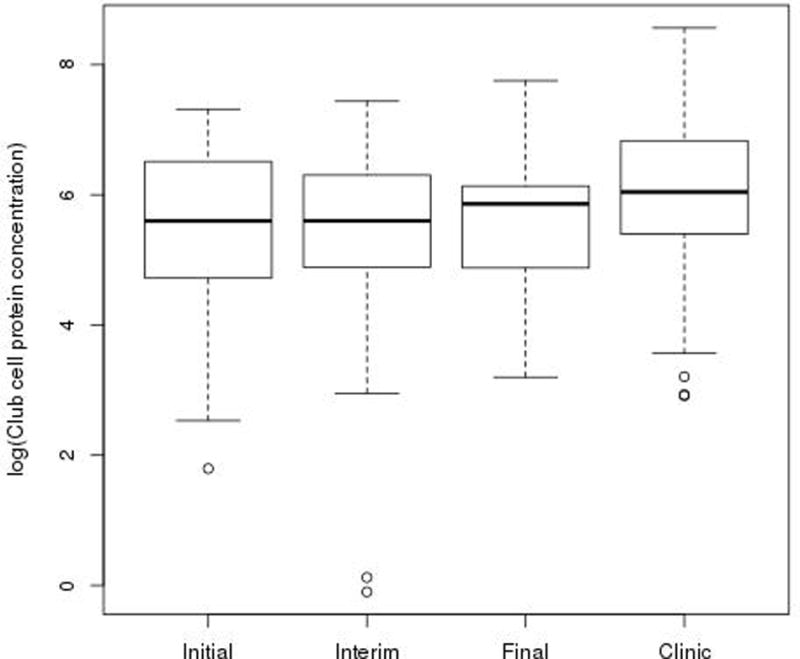
Sputum CCSP concentration was significantly lower in the initial exacerbation sample (p=0.0021), the interim exacerbation sample (p=0.0005) and the final exacerbation sample (p=0.0274) compared to baseline outpatient clinic visits. The long horizontal lines represent the median and limits of the interquartile range, the short ones represent the most extreme point that is within 1.5 IQR of the upper quartile.