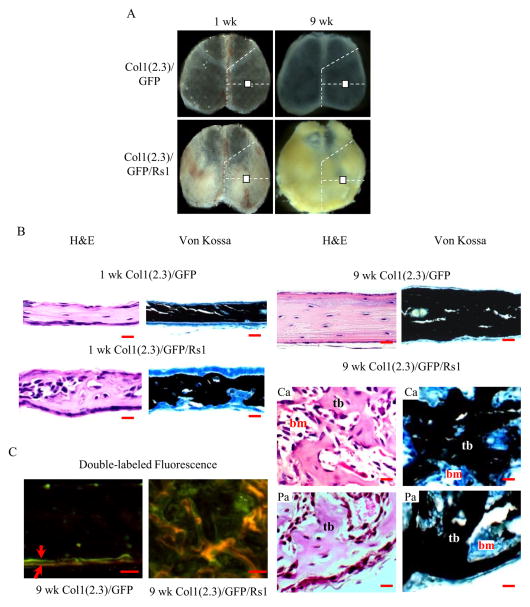
Figure 1.
(A) Gross calvarial specimens from 1- and 9-week-old mice. White box represents the region of interest for histological assessment of calvariae. (B) H&E and VK images of 1-and 9-week-old Col1(2.3)/GFP/Rs1 mice compared to controls, Col1(2.3)/GFP mice. Mutant calvariae had a dramatic increase in trabecular bone volume with a distorted cortical structure. (C) Fluorescence imaging of calvariae showed a disorganized mineralization in the 9-week-old mutant calvariae. Red arrow represents the first (calcein; green) and second labels (demeclocycline; orange). (Scale bar, 50μm) Ca, central area; Pa, peripheral area; tb, trabeculi; bm, bone marrow

