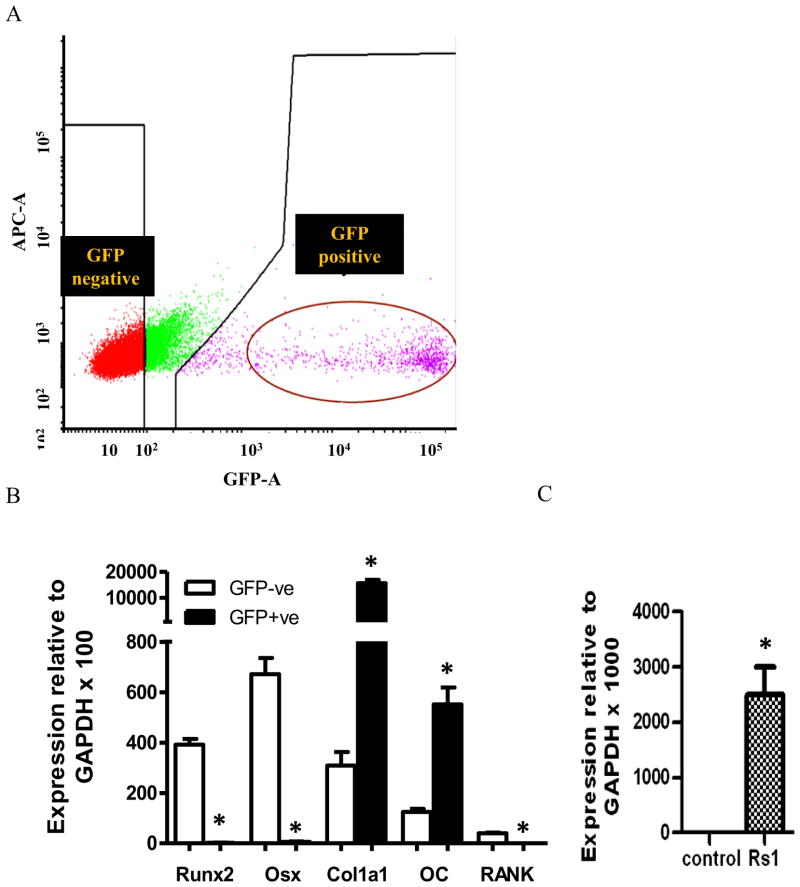
Figure 3.
(A) FACS analysis of GFP expression of cells obtained by enzymatic digestion of neonatal calvariae isolated from transgenic mice. Cell populations were reanalyzed for purity. (B) qPCR analysis of osteoblast and osteoclast marker genes with RNA isolated from GFP negative population and GFP positive population from 3 Rs1 expression OBs and 3 controls after FACS sorting. Data were normalized to GAPDH RNA expression in the same sample. *P<0.01 (C) qPCR analysis with RNA isolated from GFP positive population from 3 Rs1 expression OBs and 3 controls after FACS sorting. Data were normalized to GAPDH RNA expression in the same sample. Rs1 expression was detected only in Rs1 group.

