
Figure 4.
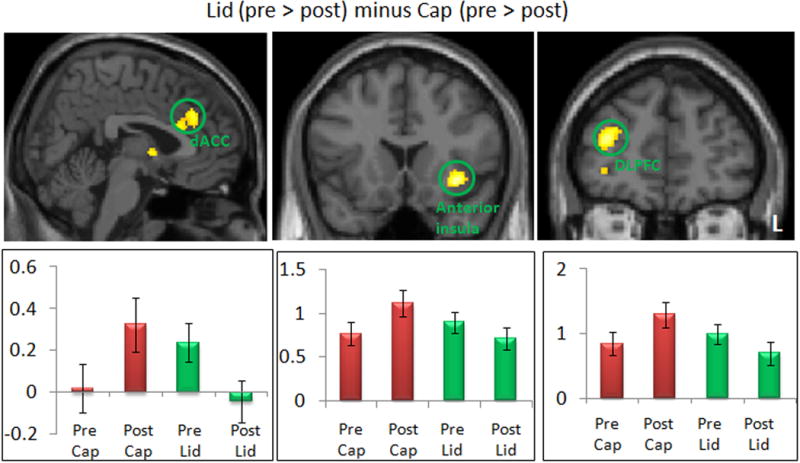
Comparison between positive (Lid) (pre > post) and negative (Cap) expectancy conditions (pre > post). The bar indicates the peak beta of each brain regions pre- and post-treatment. dACC: dorsal ACC; DLPFC: dorsal lateral prefrontal cortex; L: left side.