
Figure 2.
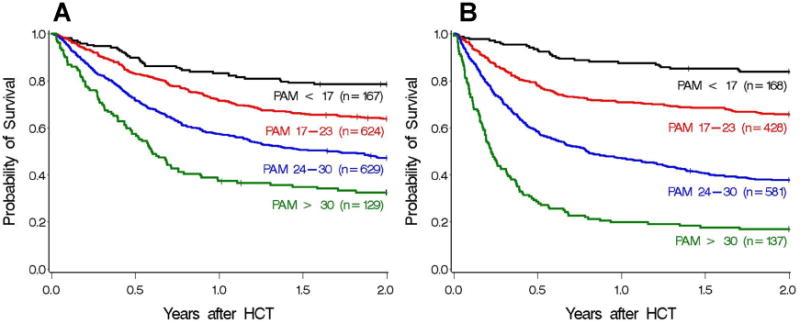
Two-year survival for the current (A) and previous validation (B) cohorts, grouped into 4 separate PAM categorizations based on the original study, where scores were grouped as < 17, 17-23, 24-30, and > 30, with the upper interval of the first 3 windows chosen so that the predicted probabilities of death by 2 years were 25%, 50%, and 75%, respectively, based on data from the original PAM development cohort. Category 1 (black): PAM < 17, category 2 (red): PAM 17-23, category 3 (blue): PAM 24-30, category 4 (green): PAM > 30. Absolute probabilities of survival are 79%, 63%, 47%, and 33% in the current cohort, and 84%, 66%, 38%, and 17% in the previous validation cohort.