
Figure 4.
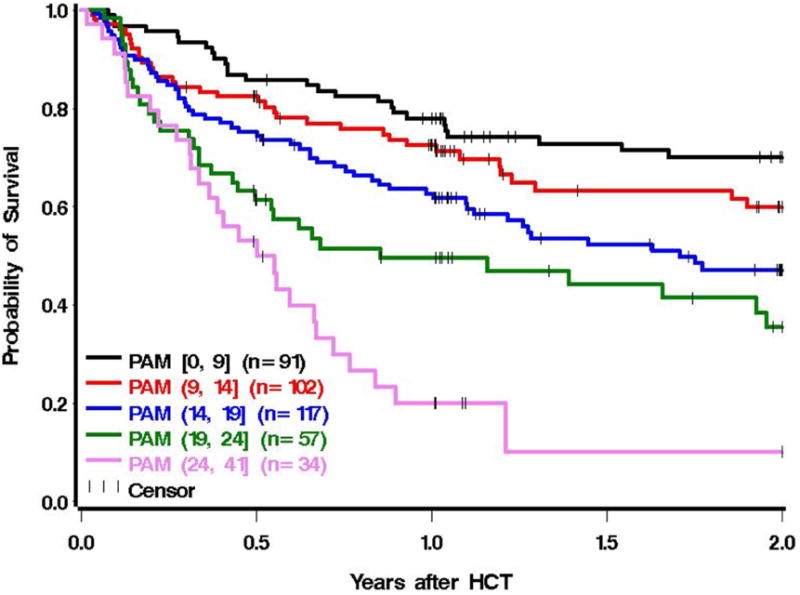
Two-year survival for the external validation cohort (n=401) from the Dana Farber Cancer Institute, grouped into 5 separate PAM categorizations that were divided into intervals of similar length. The stratification of groupings by equal interval lengths is supported by Figure A3, since the association appears relatively linear. Category 1 (black): [PAM 0-9], category 2 (red): PAM (9-14], category 3 (blue): PAM (14-19], category 4 (green): PAM (19-24], category 5 (pink): PAM (24-41].