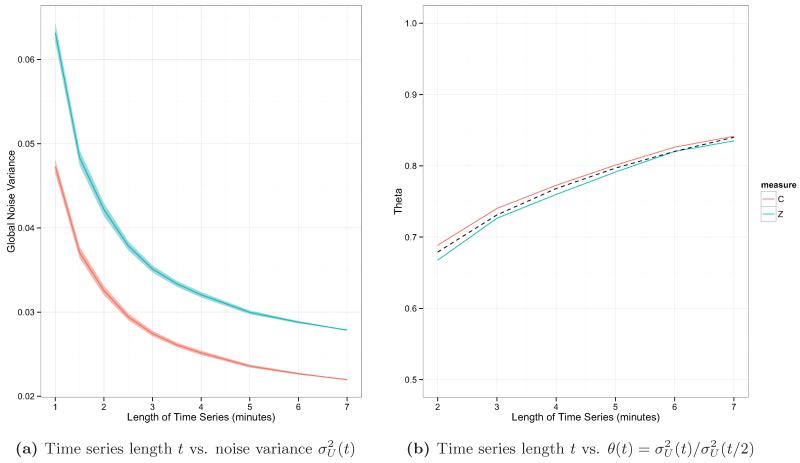
Figure 11.
The relationship between scan length and noise variance. Results are shown using untranformed correlations (C, shown in red) and Fisher-transformed correlations (Z, shown in teal) to compute the noise variance. Panel (a) shows diminishing session-to-session variance as scan length increases. Panel (b) shows how the adjustment factor changes as t increases. The fitted line relating θ(t) to log(t) is shown in black.

