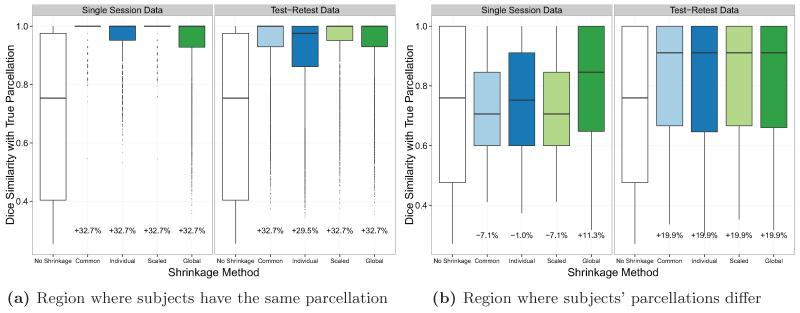
Figure 4.
Dice similarity (with each subject’s true parcellation) within two different regions: the region of the image where all subjects share the same parcellation (a), and the region of the image where subjects’ parcellations differ (b). Results were computed under the default simulation parameters of I = 20, T = 200, ρ = 0.05, , using either single session or test-retest data.

