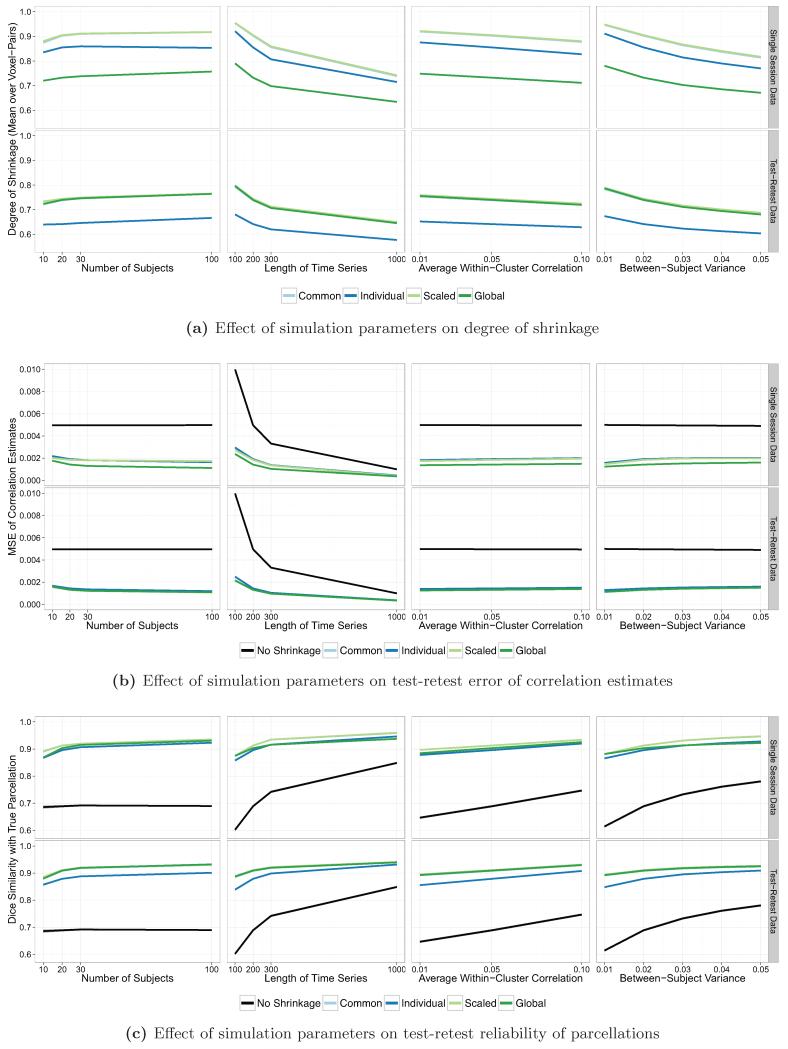
Figure 5.
Effect of each simulation parameter on the degree of shrinkage, MSE of the correlation estimates, and Dice similarity of the subject-level parcellations. Each point shows the median value over all subjects and iterations. Error bands show ±2 standard errors around the median (may not be visible due to narrow width).

