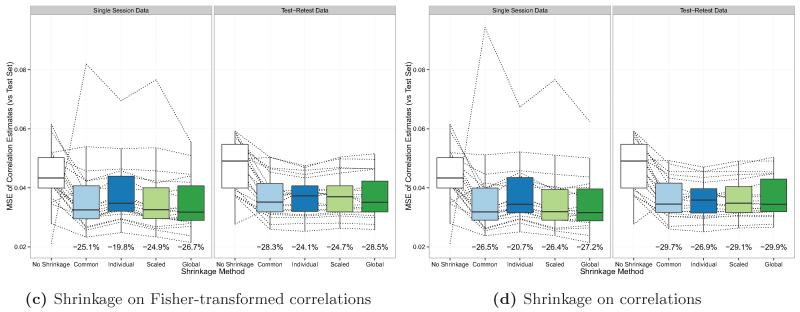
Figure 7.
MSE of raw and shrinkage correlation estimates, by noise variance estimation method and the type of dataset (single session or test-retest) used to perform shrinkage. Each dotted line shows the MSE for a single subject’s raw and shrinkage estimates, and the boxplots show the distributions over all subjects. The percent decrease in the median MSE of each shrinkage estimate (compared to the median MSE of the raw estimate) is reported below each boxplot.

